Nearly 90% of Metro Areas Registered Home Price Gains in Second Quarter of 2024
Key Highlights Single-family existing-home sales prices rose in 89% of measured metro areas – 199 of 223 – in the second quarter, down from 93% in the previous quarter. The national median single-family existing-home price rose 4.9% from a year ago to $422,100. Twenty-nine markets (13%) experienced double-digit annual price appreciation (down from 30% in the prior quarter). The monthly mortgage payment on a typical, existing single-family home with a 20% down payment was $2,262 – up 10.3% from one year ago. " data-src="https://cdn.nar.realtor/sites/default/files/styles/inline_paragraph_image/public/2024-q2-10-metro-areas-with-largest-percent-gain-in-existing-home-price-us-map-infographic-08-13-2024-1000w-1500h.png?itok=GBf5T6BI" class="b-lazy" width="1001" height="1500" alt="2024 Q2 Metro Areas With Largest Percent Gain in Existing Single-Family Home Home Price" title="2024 Q2 Metro Areas With Largest Percent Gain in Existing Single-Family Home Home Price"> See and share this infographic WASHINGTON (August 13, 2024) – Almost 90% of metro markets (199 out of 223, or 89%) recorded home price gains in the second quarter of 2024, as the 30-year fixed mortgage rate ranged from 6.82% to 7.22%, according to the National Association of REALTORS®' latest quarterly report. Thirteen percent of the 223 tracked metro areas experienced double-digit price gains over the same period, down from 30% in the first quarter. The median single-family existing-home price for the San Jose, California metro area was $2,008,000 – it's the first time since NAR began tracking metro area single-family home prices in 1979 that a metro area's median price exceeded $2 million. "The record-high home prices in most metro markets bring good and bad news," said NAR Chief Economist Lawrence Yun. "It's terrific news for homeowners who are moving ahead in wealth gains. However, it's difficult for those wanting to buy a home as the required income to qualify has roughly doubled from just a few years ago." Compared to one year ago, the national median single-family existing-home price grew 4.9% to $422,100. In the previous quarter, the year-over-year national median price increased 5%. Among the major U.S. regions, the South registered the largest share of single-family existing-home sales (45.5%) in the second quarter, with year-over-year price appreciation of 2.3%. Prices also bounced 9.8% in the Northeast, 5.5% in the Midwest and 5.4% in the West.[i] The top 10 metro areas with the largest year-over-year median price increases, which can be influenced by the types of homes sold during the quarter, all posted gains of at least 14.1%. Five of the markets were in the Northeast. Overall, those markets were Racine, Wis. (19.8%); Glens Falls, N.Y. (19.8%); El Paso, Texas (19.2%); Morristown, Tenn. (16.7%); Manchester-Nashua, N.H. (16.2%); Anaheim-Santa Ana-Irvine, Calif. (15.0%); New York-Jersey City-White Plains, N.Y.-N.J. (14.8%); Springfield, Ill. (14.8%); Dutchess County-Putnam County, N.Y. (14.2%); and Trenton, N.J. (14.1%). Seven of the top 10 most expensive markets in the U.S. were in California. Overall, those markets were San Jose-Sunnyvale-Santa Clara, Calif. ($2,008,000; 11.6%); San Francisco-Oakland-Hayward, Calif. ($1,449,000; 8.5%); Anaheim-Santa Ana-Irvine, Calif. ($1,437,500; 15%); Urban Honolulu, Hawaii ($1,101,500; 3.8%); San Diego-Carlsbad, Calif. ($1,050,000; 11.4%); Salinas, Calif. ($1,035,700; 13.1%); Oxnard-Thousand Oaks-Ventura, Calif. ($927,900; 2.5%); San Luis Obispo-Paso Robles, Calif. ($895,300; 0.5%); Boulder, Colo. ($888,300; 2%); and Naples-Immokalee-Marco Island, Fla. ($867,000; 2%). Nearly 10% of markets (22 of 223) experienced home price declines in the second quarter, up from 7% in the first quarter. "Previously fast-gaining markets took a breather in the past quarter, including Nashville, Durham, Austin, and several Florida metro areas," Yun said. "Conversely, some markets that experienced declines last year have roared back, such as San Francisco, Anaheim, and New York." Housing affordability worsened in the second quarter as mortgage rates increased. The monthly mortgage payment on a typical existing single-family home with a 20% down payment was $2,262, up 11.1% from the first quarter ($2,036) and 10.3% – or $212 – from one year ago. Families typically spent 26.5% of their income on mortgage payments, up from 24.2% in the previous quarter and 25.3% one year ago. First-time buyers encountered limited inventory and rising home prices in the second quarter, resulting in deteriorated affordability conditions compared to the prior quarter. For a typical starter home valued at $358,800 with a 10% down payment loan, the monthly mortgage payment jumped to $2,218, up 11.1% from the previous quarter ($1,997). That was an increase of $207, or 10.3%, from one year ago ($2,011). First-time buyers typically spent 40% of their family income on mortgage payments, up from 36.5% in the prior quarter. A family needed a qualifying income of at least $100,000 to afford a 10% down payment mortgage in 48% of markets, up from 40.7% in the previous quarter. Yet, a family needed a qualifying income of less than $50,000 to afford a home in 2.7% of markets, down from 4.5% in the prior quarter. "Housing affordability will improve in upcoming months," Yun said. "Mortgage rates have fallen measurably, and more supply is reaching the market. Therefore, the income required to buy a home will decrease." About the National Association of REALTORS® The National Association of REALTORS® is America's largest trade association, representing 1.5 million members involved in all aspects of the residential and commercial real estate industries. The term REALTOR® is a registered collective membership mark that identifies a real estate professional who is a member of the National Association of REALTORS® and subscribes to its strict Code of Ethics. # # # Data tables for MSA home prices (single-family and condo) are posted at https://www.nar.realtor/research-and-statistics/housing-statistics/metropolitan-median-area-prices-and-affordability. If insufficient data is reported for an MSA in a particular quarter, it is listed as N/A. For areas not covered in the tables, please contact the local association of REALTORS®. NOTE: NAR releases quarterly median single-family price data for approximately 220 Metropolitan Statistical Areas (MSAs). In some cases, the MSA prices may not coincide with data released by state and local REALTOR® associations. Any discrepancy may be due to differences in geographic coverage, product mix, and timing. In the event of discrepancies, REALTORS® are advised that for business purposes, local data from their association may be more relevant. 1 Areas are generally metropolitan statistical areas as defined by the U.S. Office of Management and Budget. NAR adheres to the OMB definitions, although in some areas an exact match is not possible from the available data. A list of counties included in MSA definitions is available at: https://www.census.gov/geographies/reference-files/time-series/demo/metro-micro/delineation-files.html. Regional median home prices are from a separate sampling that includes rural areas and portions of some smaller metros that are not included in this report; the regional percentage changes do not necessarily parallel changes in the larger metro areas. The only valid comparisons for median prices are with the same period a year earlier due to seasonality in buying patterns. Quarter-to-quarter comparisons do not compensate for seasonal changes, especially for the timing of family buying patterns. Median price measurement reflects the types of homes that are selling during the quarter and can be skewed at times by changes in the sales mix. For example, changes in the level of distressed sales, which are heavily discounted, can vary notably in given markets and may affect percentage comparisons. Annual price measures generally smooth out any quarterly swings. NAR began tracking of metropolitan area median single-family home prices in 1979; the metro area condo price series dates back to 1989. The seasonally adjusted annual rate for a particular quarter represents what the total number of actual sales for a year would be if the relative sales pace for that quarter was maintained for four consecutive quarters. Total home sales include single-family, townhomes, condominiums and co-operative housing.
Read More-
On this International Cat Day, we celebrate pet owners. Did you know there are more households with pets than children? These beloved pets are a driver of a major facet of economic activity: home buying. About one-fifth of recent home buyers considered their pet in their neighborhood choice—a share that increases among unmarried couples and single women buyers. Let’s dive in! According to the U.S. Census, the share of families with children under the age of 18 living in their homes has continued to decline. That share, in 2023, stands at 39%, down from 52% in 1950. This is likely due to two factors: birthrates overall have been declining, and there is a large share of Baby Boomer households whose children may have already left the nest. " data-src="https://cdn.nar.realtor/sites/default/files/styles/inline_paragraph_image/public/economists-outlook-families-with-children-under-the-age-of-18-1950-to-2021-line-graph-08-08-2024-1300w-781h.png?itok=pqce9DNk" class="b-lazy" width="1200" height="721" alt="Line graph: Families With Children Under the Age of 18, 1950 to 2021" title="Line graph: Families With Children Under the Age of 18, 1950 to 2021"> This trend is mirrored among home buyers. In 1985, 58% of home buyers had children under the age of 18 in their home. In 2023, just 30% of home buyers had a child under the age of 18 in their home—an all-time record low. " data-src="https://cdn.nar.realtor/sites/default/files/styles/inline_paragraph_image/public/economists-outlook-share-of-buyers-with-a-child-under-18-1985-to-2023-line-graph-08-08-2024-1300w-729h.png?itok=173RvujG" class="b-lazy" width="1200" height="673" alt="Line graph: Share of Buyers With a Child Under 18, 1985 to 2023" title="Line graph: Share of Buyers With a Child Under 18, 1985 to 2023"> While the number of children in U.S. households has declined in the last twenty years, pet ownership has risen. According to the American Pet Products Association, 66% of American households own a pet, up from 56% in 1988. Throughout the COVID-19 pandemic, Americans adopted pets for companionship and entertainment; however, this number has eased from the recent peak. The American Pet Product Association reports that dogs and cats are the most common household pets. Americans are investing a significant amount of time and financial resources toward their animals. The amount of time spent with pets has increased dramatically in 20 years. According to the BLS American Time Use Survey, the share of Americans who are spending time on their pets and the amount of time spent have both increased. In 2003, 13.2% of Americans spent time with their pets daily. In 2023, that share has grown to 20.4% of men and 23.8% of women. Not only are people spending additional time with pets, but also finances. According to the American Pet Products Association, total U.S. pet industry expenditures have grown from $53.3 billion in 2012 to $147 billion in 2023. " data-src="https://cdn.nar.realtor/sites/default/files/styles/inline_paragraph_image/public/economists-outlook-share-of-americans-who-spent-daily-time-with-their-pets-2003-and-2023-bar-graph-08-08-2024-1300w-762h.png?itok=9ZHHABB4" class="b-lazy" width="1200" height="703" alt="Bar graph: Share of Americans Who Spent Daily Time With Their Pets, 2003 and 2023" title="Bar graph: Share of Americans Who Spent Daily Time With Their Pets, 2003 and 2023"> Given the increased share of pets in households and the increased time and resources spent on pets, it is no surprise that some home buyers consider their pets as the most important factor when making homebuying decisions. Proximity to the vet and outdoor space for pets are important aspects for buyers with pets. Among all unmarried couples, 29% of home buyers considered their pet when deciding which neighborhood to purchase, compared to 19% of married couples. According to the 2024 Profile of Home Buyers and Sellers, 20% of single women considered factoring their pets into their neighborhood choice in comparison to 15% of single men. This trend is similar to the BLS Time Use Survey (see above graph), which found that women are more likely to spend time with pets on a daily basis. " data-src="https://cdn.nar.realtor/sites/default/files/styles/inline_paragraph_image/public/economists-outlook-share-of-recent-home-buyers-who-factored-their-pet-into-neighborhood-choice-bar-graph-08-08-2024-1300w-762h.png?itok=ZjXtJcSY" class="b-lazy" width="1200" height="703" alt="Bar graph: Share of Recent Home Buyers Who Factored Their Pet Into Neighborhood Choice" title="Bar graph: Share of Recent Home Buyers Who Factored Their Pet Into Neighborhood Choice"> Among those who did consider their pet to be very important to their neighborhood choice, they also were more likely than those who did not factor in a pet for other neighborhood features. Pet lovers also purchased a home in an area with the availability of larger lots or acreage and were more interested in convenience to parks and recreation areas and walkability. This is not a surprise as it is likely not just the human who desires these neighborhood features but the pets themselves who need room to run and play. " data-src="https://cdn.nar.realtor/sites/default/files/styles/inline_paragraph_image/public/economists-outlook-buyers-neighborhood-factors-most-important-among-those-who-considered-pet-bar-graph-08-08-2024-1300w-835h.png?itok=XmIc7C_r" class="b-lazy" width="1200" height="771" alt="Bar graph: Buyers Neighborhood Factors Most Important Among Those Who Considered Pet" title="Bar graph: Buyers Neighborhood Factors Most Important Among Those Who Considered Pet"> Happy International Cat Day, cat lovers! For more trends on home buyers and recent activity of buyers, check out the full 2023 Profile of Home Buyers and Sellers report.
Read More Instant Reaction: Mortgage Rates, August 8, 2024
Facts: The 30-year fixed mortgage rate from Freddie Mac dropped to 6.47% this week, compared to 6.73% last week. At 6.47%, with 20% down, a monthly mortgage payment on a home with a price of $400,000 is $2,016. Compared to October 2023, when rates were 7.79%, this is a monthly payment difference of $285 —$3,420 a year. Positive: Mortgage rates are at their lowest weekly level since May 2023. This is the biggest one-week fall in mortgage interest rates in nine months. Mortgage applications are up. Home buyers who stepped off to the sidelines while waiting for rates to fall: rates have now fallen. Negative: Yes, this is just one component of housing affordability, and yes, home prices are still high. Additionally, this is a weekly average.
Read MoreJuly 2024 Commercial Real Estate Market Insights
" data-src="https://cdn.nar.realtor/sites/default/files/styles/wysiwyg_small2/public/2024-07-commercial-real-estate-market-insights-08-07-2024-300w-433h.png?itok=e3UVY_e0" class="b-lazy" width="200" height="289" alt="Cover of the July 2024 Commercial Real Estate Market Insights report" title="Cover of the July 2024 Commercial Real Estate Market Insights report"> Download PDF While the market awaits the interest rate cuts from the Federal Reserve, commercial real estate is also on hold. The office sector ended the second quarter with a record-high vacancy rate of 13.8%, though the increase in unoccupied spaces has slowed down. The retail sector continues to have the lowest vacancy rate among all sectors, but demand for retail spaces has further decreased. The industrial sector’s fundamentals also softened in the second quarter, with net absorption hovering at levels not seen since 2012. However, demand for apartments continued to surge as seven percent mortgage rates hurt housing affordability. Office Properties While net absorption for the office sector remains negative, with more spaces being vacated than occupied, the second quarter saw fewer additional unoccupied spaces. The surplus of unoccupied office spaces exceeded 61 million square feet at the end of last year and the beginning of 2024. However, in the second quarter, net absorption improved to -42 million square feet, a 1% decrease from a year ago. This indicates that there is a slight increase in demand for office space. Nevertheless, the outlook suggests that net absorption in this sector will remain negative. Leasing activity, an indicator of demand and interest from potential tenants, is currently near pandemic levels and about 40 percentage points below pre-pandemic levels. " data-src="https://cdn.nar.realtor/sites/default/files/styles/inline_paragraph_image/public/2024-q2-office-properties-net-absorption-in-square-feet-bar-graph-08-07-2024-514w-510h.png?itok=IjB5Ssev" class="b-lazy" width="514" height="510" alt="Bar graph: Office properties net absorption in square feet, Q2 2024" title="Bar graph: Office properties net absorption in square feet, Q2 2024"> Multifamily Properties In contrast, the multifamily sector continued to gain momentum with mortgage rates remaining near 7%. In the second quarter, net absorption was 2.4 times higher than a year ago, with an additional 260,890 more multifamily units leased than vacated. Demand was also 44% higher than the pre-pandemic level. However, despite this strong demand, the record high number of new multifamily units delivered to the market kept the vacancy rate steady compared to the previous quarter and higher than it was a year ago. " data-src="https://cdn.nar.realtor/sites/default/files/styles/inline_paragraph_image/public/multifamily-properties-top-10-areas-with-fastest-rent-growth-q2-2024-and-q2-2023-table-08-07-2024-520w-598h.png?itok=NbjKYL3v" class="b-lazy" width="520" height="598" alt="Table: Multifamily properties top 10 areas with fastest rent growth, Q2 2024 and Q2 2023" title="Table: Multifamily properties top 10 areas with fastest rent growth, Q2 2024 and Q2 2023"> Retail Properties In the meantime, availability conditions in the retail sector have remained tight. Since the end of last year, only 4.7% of retail space is currently available for lease, marking the lowest level on record. This limited availability of retail spaces has kept the vacancy rate near 4%, despite the slowdown in demand. Specifically, in the last 12 months, demand for retail spaces has increased by nearly 41 million square feet compared to 56 million square feet a year earlier. With new construction deliveries decreasing further, the fundamentals of this sector are expected to remain tight in 2024. " data-src="https://cdn.nar.realtor/sites/default/files/styles/inline_paragraph_image/public/retail-properties-net-absorption-over-12-months-by-type-2014-to-2024-line-graph-08-07-2024-1040w-464h.png?itok=sUehMLcM" class="b-lazy" width="1040" height="464" alt="Line graph: Retail properties net absorption by type, 2014 to 2024" title="Line graph: Retail properties net absorption by type, 2014 to 2024"> Industrial Properties Fundamentals for the industrial sector further weakened in the second quarter. Net absorption continued to lose steam, falling to 41 million square feet. While demand for industrial space reached record-high levels at the end of 2021 and the beginning of 2022 - driven by the demand for warehouse space to support online shopping and e-commerce - net absorption is now 64% lower than a year ago and 53% below the pre-pandemic average level. The outlook suggests additional softening in this sector. With consumer spending shifting away from goods to services due to high borrowing costs, demand for industrial spaces is expected to ease further in the coming months. " data-src="https://cdn.nar.realtor/sites/default/files/styles/inline_paragraph_image/public/industrial-properties-top-10-areas-with-the-strongest-12-month-absorption-q2-2024-and-q2-2023-table-08-07-2024-506w-600h.png?itok=_efGOpG2" class="b-lazy" width="506" height="600" alt="Table: Industrial properties top 10 areas with the strongest 12-month absorbtion, Q2 2024 and Q2 2023" title="Table: Industrial properties top 10 areas with the strongest 12-month absorbtion, Q2 2024 and Q2 2023"> Hotel Properties As we conclude Q2 2024, the hospitality sector is seeing improvements. Hotel occupancy rates have leveled off at around 63%, remaining roughly 3% below pre-pandemic figures, which suggests that a complete recovery may be elusive due to the prevalence of remote work. Nevertheless, average daily rates and revenue per available room have now exceeded pre-pandemic benchmarks. " data-src="https://cdn.nar.realtor/sites/default/files/styles/inline_paragraph_image/public/hotel-properties-12-month-occupancy-rate-in-june-2019-to-2024-bar-graph-08-07-2024-500w-288h.png?itok=BcgI4HQZ" class="b-lazy" width="500" height="288" alt="Bar graph: Hotel properties 12-month occupancy rate in June 2019 to 2024" title="Bar graph: Hotel properties 12-month occupancy rate in June 2019 to 2024"> Download the full report
Read MoreUnlocking Global Opportunities
On July 31, 2024, NAR held a virtual webinar that provided findings from the 2024 International Transactions in U.S. Residential Real Estate report, and discussed how REALTORS® are unlocking global opportunities in the residential real estate market. The speakers were Stephanie Aker, manager of NAR Global Council Development & Engagement, and Matt Christopherson, director of NAR Business & Consumer Research. Welcome, everyone. We're just going to give everyone just a moment to join here. All right, well, let's get started. So first of all, I want to thank everyone for joining us. This is the first ever launch for the international report. So again, thank you everyone for joining us. My name is Stephanie Aker. I am the Manager of Global Council Engagement and Development here at NAR, and I am joined by one of my amazing colleagues, Mr. Matt Christopherson. Hello, everyone. Thanks, Stephanie, and thanks. Thank you everyone for joining us. Like she said, my name is Matt Christopherson, and I'm part of the research team here at NAR. To get things started, we just wanted to give a quick, very quick overview of what we produce in research. And Stephanie will share all of the happenings with Global. But in the research team at NAR, we have an amazing team of researchers and economists, and we put out a lot of resources for you all to use in your practice. And it can essentially be broken down into statistics, commercial research and survey research. So I'm just going to give a brief highlights of what we put out, but you can see there's a QR code in the corner that will allow you to follow our social media and see daily updates of everything that we put out. But we, on a monthly basis, put out our existing and pending home sales. Existing lets us know what's happening in the market now, while pending home sales just released this morning gives us more of a precursor of what's to come. We put out quarterly home prices at down to the metro level so you can see your own market. Our housing affordability index compares those price data to salary and wage information to see just how affordable housing is. And we also have a lot of great analysis on migration of where people are moving to and from. We also have some great research on the commercial side of things. We put out a monthly commercial market insights report that we show everything that's happening and analysis of that of every sector within the commercial market. We also look at international trends in commercial as well and we produce commercial metro market report. So this is down to again your metro market and we can see economic and demographic conditions in all of the KPIs of the commercial sectors of your specific market. We also put out a ton of survey research. We have our annual flagship report, which is a profile of home buyers and sellers, and we really examine the entire experience of all buyers and sellers nationwide. We look at who they are, what they're looking for, characteristics of the homes bought and sold, how they finance the purchase, and even tools that they're using in the process. We also break all of that information down by generation in our generational trends report. We have a monthly REALTORS®® Confidence Index report that really gives you up-to-the-minute kind of a pulse of what's happening in the market and market insights. We look at differences of different races and their home buying experience. We have reports looking at sustainability in both residential and commercial. And we also have our international report, which we will talk a bit about today. All right, Well, I'm going to talk just a little bit about global. I think most of you who are joining us here today know what NAR Global does, but just to give you an idea of everything that we do here. So the purpose of NAR Global is to develop market or global markets, raise the level of professionalism and help our members be more successful. And that is one of the main reasons we are here today, is to discuss this report, how you can grow your business, how you can get engaged with global and, you know, just make you aware of all the offerings that are here. So our global presence on NAR, for those of you who don't know, we have partnerships. We're, we're in six countries or I'm sorry, 6 continents, 78 countries. So everywhere that there's not, you know, ice and snow and you know, no one living pretty much we are there. We're in 78 countries. We have over 100 bilateral partners. So these are partnerships that we have with either real estate associations, just like your association and NAR or educational, we partner with some from prop tech companies worldwide. So pretty much anyone who is contributing to the, the professionalism, the real estate industry, you know, we partner with them. And then worldwide, we have over 8000 international REALTOR® members. So these are members who are REALTORS® just like you. They abide by the same code of ethics, they're held to the same standards, and they're excited to participate in global business with you. So ways that you can get involved. We do have 25 global ambassadors. These are individuals who are volunteer leaders. They represent a group of countries and work with our bilateral partners. So they are an excellent resource. We have 6 global coordinators who work to support those ambassadors. And again, these are volunteer leaders. We have over 130 global councils in 28 states, and we are growing that number. So if your association does not have a global council or if you want to know how to get more involved, please reach out to me and I will help you with that. And then we also have our ambassador associations which really have that special kind of sister city relationship with our bilateral partners. So that is just a little bit about an AR global. So I had the opportunity over the last few days to meet with some of our amazing members who are really just crushing it and global and highly involved with international business. And I wish that I could share all of the information that they had. But we do have some of the highlights here for you. And I'm really excited about this panel. We have a really diverse group here for you. We have, we even have some association presidents and chairs and global chairs. So I will, I'll stop going on here and I will let them introduce themselves. Thank you for having me. My name is Dora Omana and I have been a broker for about 22 years and the state of New Jersey, both in the state of New Jersey and New York. I work at COVID banker and I belong to GBR, the Greater Bergen REALTORS® Association in New Jersey. And I my background is I am an attorney in Columbia and I came to the United States and I sat for the New York bar exam and I finally passed it and eventually I'll get my license as an attorney in the state of New York. I am passionate about real estate because I believe in real estate and I have, I hold multiple certifications. I am a ABR® CIPS, and GRI. What else is there…SFR, I mean so many I don't even you know, remember all of them. Hi I'm Monica Mauricio, I'm a REALTOR® in Memphis, TN. I'm a broker with RE/MAX Experts and I serve in our local association. The past, I've served the past two years on the Board of Directors and as Secretary Treasurer and this year I am on the Governing Docs committee at the local level and at the state level I chair the Global Business Forum and on the Professional Standards Committee and at the national level I serve on the CIPS Advisory Board and enjoy everything that I do to give back to our profession. I'm Didi O'Hara Blizzard and I'm based in Novi, MI. I'm the 2024 president of GMR and the broker owner of Global Real Estate Consulting. Hello everyone, my name is Spencer Hu. I'm based in Southern California, Orange County and Los Angeles County metros. I have been involved in real estate about 20 years now and over half has been with the Global Focus. I am a CIPS designee at home with diversity ePRO®, NAR Green, just a few. I'm sure there's a couple more and I am currently with Epic Realty, which is AE broker covering most of United States and hoping to go global soon with their expansion and also run a consulting company on the side that is global. I'm Tony Harrington and I am the managing broker in Wilmington, NC. I, I do hold the Certified International Property Specialist designation as well as other designations, but I have been working in the global arena for our state in North Carolina for many years. And I have been the chair of our global program for many years until just recently where I'm the current 2024 state President. So that is a lot of experience and a lot of different, you know, different backgrounds there. But Matt, so I have a question for you before we move on. We're going to be quizzing or quizzing our participants throughout the session here, but I have a quiz for you upfront with all of our different panelists here. They all share 4 letters. Do you know what those are? Would it be CIPS? Got it. Wonderful. You get the gold star for the day. Wonderful and great panelists. It's great hearing from them and we'll hear more from them throughout. But today, we're going to be talking a lot about the findings from our 2024 International Transactions and US Residential Real Estate report. So this is a study that we conduct annually and we've been doing this since 2009. So we have many years of historical data to look at, to compare to and look at any shifts and trends that are happening. This year's survey was conducted in April and we were looking at April of 2023 through March of this year. And over 17,000 REALTORS® nationwide responded to the survey. So we have a lot of great data. We cover a lot of data points as well. We look at international buyers. We look at where they're coming from, where they're purchasing and preferences like what types of property they're purchasing, how they intend to use it. We also look at the transactions themselves. We look at their price points and any differences there, how they're financing the purchase and also where REALTORS® are getting these leads to work with these global clients and opportunities. Also for the first time ever this year, we have the report available in Spanish. So you can also feel free to use this and share with any of your Spanish contacts and clients in your networks. And also there is an option and to receive a localized version of this report. A handful of local and state associations did that this year and I'm happy to discuss with anyone that's interested in getting a report like this specific to your market. So we'll jump in to set the scene. First, we have some background information. One of the aspects that we look at surrounding this is monthly forest tour tourist attractions, sorry, arrivals to the US So we're looking at foreign travel to the USA. Lot of these foreign buyers will likely want to come to the US to look at properties, to look at the areas that they're purchasing in to make that purchase. The headline here, as you can see, obviously foreign arrivals to the US took a serious drop when the pandemic hit and we've been generally recovering since then. However, as you can see, we still did not reach those pre pandemic peak levels that you could see before the pandemic. However, the recovery is there. There's plenty of interest of people coming over here. We also like to show this global price comparison. So you're looking at the purchase price per square meter of these cities globally. On the left side are global cities outside of the US, and they're some of the most expensive. Some of these cities are where are foreign buyers actually coming from? On the right side, you can see that even in the most expensive cities and areas in the US, they're getting significantly more for their money, making it a fantastic investment. Not only are they getting more for their money to start, but it's also a growing and strong investment. Awesome. All right, so as I said earlier, we're going to be quizzing you all and seeing how much you know about international real estate. So full time, what was the dollar volume of foreign purchases of US residential real estate in 2024? Let's see your answers. All right, give me a few more seconds here. Lock in your answers. See, some of you have read the report already. All right, All right, Matt, some of the results, yes. So more than 1/3 of you got it. Some of you have done your homework already. So the total dollar volume of foreign purchases last year was $42 billion and we'll look at what that looks like in context in a moment. So part of the report for additional background, we look at what's happening globally in the economy and here are just the headlines of that. So during the data collection. There was global inflation, there was inflation happening across the globe. This obviously makes any everyday purchases more expensive, but it definitely effects property purchases when this is often the biggest purchase someone is making in their entire lives. However, the US dollar is much stronger this year. It's a lot stronger than a lot of foreign currencies, even currencies from where these buyers are coming from. This mean it's great for us Americans, especially when we're travelling abroad, but it makes those property purchases that much more expensive for foreign buyers. At the same time, there were plenty of wealth gains in the market, bringing about more potential buyers with wealth on hand to be able to make these investment decisions. And it continues to be a great investment to purchase US residential properties. Our low inventory situation along with a lot of pent-up demand in the market has kept prices strong and even growing, making it a continued strong investment. But here we see the total of foreign purchases in the US last year. So here you can see last year there were 54,300 purchases by foreign buyers last year. That may sound like a lot when you hear it by itself. However, as you can see, it's significantly lower than we were pre pandemic and it's actually down 36% from last year. It makes up 1.3% of total existing home sales. So it's actually quite a small slice of the pie if you will.This is because these buyers are really being held back by the same barriers that US buyers are dealing with it. They're having low inventory and high prices, which we'll talk about more. But as you can see, it's quite a bit lower than it has been in the past. This is where it translates to dollar volume. You saw with that poll question that foreign purchases totaled $42 billion last year. Again, that is not an insignificant amount of money by any means, but it's only 2% of total dollar volume of existing home sales. So there's plenty of room for increase in here if they can only find the available inventory. One point to point out is that while the number of purchases decreased by 36%, the dollar volume increase, sorry, decreased by just 21%, illustrating that they're purchasing at a higher price point. There's fewer purchases, but it's more dollar volume per purchase. That's awesome. So now that we've kind of taken a look at maybe some of the opportunities that are coming in and you know where the opportunities lie and you know how we can increase our business, let's hear from some of our experts on how they connect with their international buyers. If I'm travelling, that's usually one of the first when I start meeting people. Do you, you know, you explain where you tell where you're from. And I ask people, do you know anyone who's going to be moving or who lives in Tennessee? And they either will or they will remember you later because you're going, because I'm going to continue that relationship. I'm going to keep that going. So that's how I connect many times internationally. I keep up with companies that are opening and maybe someone is really, I understand how as an immigrant, you come to the United States without having the knowledge and being able to rely on somebody that got used through the process. And it's it's, it really makes it more efficient for them immigrant. And from the REALTORS® perspective, I think that is important that as REALTORS® we understand the impact than we have on those decisions that immigrants make or international clients make. So we do a lot of social media to stay in front of that group. And I would say probably 70% if not more of our business is from referrals and these are from other REALTORS®. So a lot of them basically do run across clients that are looking of course to purchase, whether it's our local area here in Southern California. And know that we basically have kind of a multicultural, multi lingual Co-op, not necessarily A-Team, but we have a group of agents that we work together well that are from very, very different backgrounds or multiple different backgrounds. One of the benefits of successfully engaging in global business for this long is the repeat business that I have and the new business that I generate from referrals. The majority, if not all of my global business is by referral. You know, I think that the one thing that we need to remember about international buyers is when we take a look at our neighborhoods and our communities, we have to remember that we've got international and global all around us. If you have hospitals, if you have university systems, if you have industries that are coming from other parts of the globe, those are all cultivating economic development and growth within our state of international people coming in to work in those fields. We've got to identify those arenas in those areas. Now, if we start out and we don't know where these industries are, it's very easy for us to connect with our economic developers and our Chambers of Commerce so that they can tell us the makeup of our communities. And that's the first thing in understanding who and where international and global people are in your communities. Now that we know how that they're, you know, or how they're connecting, let's take a look at how it's impacting their business. I remembered that when I opened my business years ago, when I found out that I could actually work in the international arena, I totally rebranded my business and realized that I had to own it. I had to understand it and I had to dive into it. And that took my business to the next level when it, when I understood the bigger picture and the global arena and where our buyers and sellers are coming from. For me, global is my business accounting for over 95% of all revenue in some way or another. In my business, I mostly work with either immigrants or somehow immigrants and also international investor. Well, global is my business. Probably 75% of my business are people from other countries. They're international buyers as I said before, mainly from Mexico and Central America, but without my international purchasers or sellers buying their second home, I wouldn't, I wouldn't be as successful as I am. We're great input for my REALTORS®. So another way that we break down the data throughout the report are by what we call buyer types. So we have type A non-resident foreigners and type B resident foreigners. So those non-residents are fully not U.S. citizens and they're fully living abroad, purchasing property here. Resident foreigners are people that are living in the US, but they're simply not citizens quite yet. They're non-citizens who have immigrated here within two years of the transaction or they're visa holders. So they're here for professional, educational or other reasons. As you can see in the lighter blue, typically we have more resident buyers, so more people that are living within the US that just simply aren't U.S. citizens. A large portion of these folks are just, are in the process of becoming citizens, but they choose to make a purchase of a property before that is completed knowing that it's a great investment to get in on US real estate. As you can see, last year we actually had an increase in those non resident buyers, but we're back to normal this year with 50% residing in the US. So this may make you start thinking of where they're coming from. We did ask our panelists which country was the number one investor in US residential real estate. Let's hear their answers. China, I feel that Colombia definitely was a big force in the investment in investing in this year. And probably Korea, I think that it's always actively, you know, investing in in, in our country. So yes, I would say Colombia and Korea. So I would say either China or Japan would be my first choices. And I know that's too. So I'm in that part of the world. I would think probably China. Let's go with China. So here we see the top five origins of foreign buyers by country. So Canada is in that number one spot. So China actually historically has almost always been in the number one spot, bringing a lot of dollar volume, especially to this country. They were held back during the pandemic with some of the strictest travel bans and restrictions and general uncertainty of what was to come. Last year, they actually regained the number one spot, but Canada is back in the number one spot. The Chinese yuan is actually a bit weaker this year compared to the US dollar, which likely contributed to them losing that number one spot. But Canada brought in 13% of all foreign buyers, with China and Mexico each bringing in 11%. India actually had a bit of an increase in buyers this year, now making up one in 10 foreign buyers and Colombia is in that #5 spot with 4%. So even though our panelists, we, we heard a lot about China, they weren't wrong. I mean, China did spend the most money. They just weren't the number one volume wise. Yes, exactly. So we, we rank the top origins by number of buyers, but China did bring in the highest dollar volume. Let's look at where they bought. Here we can see of each of the top five countries where they primarily purchased. So Canadian buyers at number one group, they're primarily purchasing in Florida and Arizona. They're escaping the Canadian cold and coming to the American southern heat. Chinese buyers are largely purchasing in California and Florida. Mexican buyers are largely purchasing in Texas with that proximity and affordability, Indian buyers mostly purchasing in Florida and Texas, and Colombian buyers almost solely purchasing in Florida, largely led by Miami. A lot of this comes into play with not only reasons surrounding how they're going to use the property, but also cultural reasons and also financial reasons. What can they afford? Speaking of here, we have the price points of their purchases. So foreign buyers typically purchase at a much higher price point than US buyers. US buyers in recent years have been purchasing at much higher price points given, like we've said, the situation of a competitive market because of the low inventory, high demand bringing us high prices. However, foreign buyers really increase their price point this year even more significantly to the highest purchase point that we've seen ever recorded in the study at $475,000. Yeah, Matt, can I just say this is one of my favorite numbers because right here, This is why you need to get involved with global because when you look at that medium or sorry, median purchase price by foreign investors, you can see the significant, you know it's significantly higher. So definitely a reason to get into global. Yes, it's a huge opportunity. So here we see that breakdown between those resident and non-resident buyers and this was an interesting finding this year. Typically those resident buyers purchase at a higher price point than non-residents. If you think about it makes sense you would spend a bit more on your primary residence than you would on a secondary or investment property. However, this year non-residents paid a little bit more than those resident buyers, but still pretty similar price points and all higher than what US buyers were spending their over that same data collection. When we break it down by country of origin, you can see a big differences here. China. Chinese buyers consistently spend the most on their property purchases here in the US, spending almost $700,000 on just your median priced home among them. I mentioned that India had an increase in buyers. They also had an increase at in their purchase point and their price point at 6:25. You can also see that Mexican and Colombian buyers are a quite a bit lower at their price point. They're purchasing in more affordable States and it will make even more sense when we see how they're using those properties. But you can see they're actually purchasing at the lower price point than the typical US buyer. Speaking of price points, how are they financing? All right, So what question #2 what share of foreign buyers completed the purchase with only cash last year? So we love those cash buyers. OK, give you a few more seconds here to get your answers in. Yeah, we have some really smart members. Man, I love it. Yes, yes, outstanding, okay, about three more seconds here to lock in your answers. Oh, I ended it early, but it looks like a majority of you got that correct. The correct answer is 50%. Wow, that is awesome. OK, all right, so again, you know, as we're working through this and looking at the opportunities and financing and where they're buying, our experts gave a little bit of advice on, you know, are giving a little bit of advice to those you who are looking to get started in or grow your business so that you can get involved with some of these opportunities and take advantage of it. If you're if you're wanting to get into international, there's so much that's already done for you. You just have to put in the work and your passion and make an investment in yourself. CIPS, I think that being a CIPS earning and holding at the CIPS designation provides you with the tools of a well-rounded REALTOR®. Because it's not only that you are aware of those subtle of essential differences and that you, some, some people just say, well, we, we have to be, you know, tolerant. And I just believe that we need to be more inclusive rather than tolerant. So that's what CIPS gives the, the, the REALTORS®. It's a different perception. And it's the ability to see, to view, to understand and to act accordingly and serve in in a way that is good for everybody. The other thing isn't it, I think the best advice for agents that want to learn how to become global or actually just directly jump into it is become involved. And become involved basically means the first source is that your local association is their global council. I believe that being focused in the global arena, it opens your mind and your space to be able to work in that vein. You know, when real estate, there are different veins that you can work in. You could be working with the military, you could be working with buyers, you could be working with commercial. But international and global is its own specific arena. And when you open your mind to the opportunities that exist in incoming and outgoing opportunities with international investors, you know, that takes your business to the whole different. I recommend that agents looking to start or grow their international business to do the work get serious about learning all you can. Courses like the Certified International Property Specialty, CIPS, are a great way to start your journey. Then follow that up with supplemental courses to expound your knowledge and your specific niche, as well as how to operate the international segments of your business. This is crucial to your success and the difference in, as we say, from just being global or doing global. Being global is fun. Doing global is viable or gets you paid. Either is fine depending on what your goals are. I love it. I absolutely love it. And I think we're hearing that common theme, you know, get involved, reach out, educate yourself. You know, Honey Yar has so many amazing resources to get involved, educate yourself. And you know, that's the beautiful thing about, you know, being a member and also being a part of your global councils is, you know, that sense of community and networking and support. So, yes, and I'm just checking in to see questions as they come in and it looks like they're all currently answered. So we'll keep this thing moving, but as we continue, please feel free to continue submitting your questions and we'll have some time to answer more at the end. Awesome. Yeah, Meredith is a rock star. She is. She is on those questions. So thank you, Meredith. All right, so moving on, we asked our panelists which states were the number one and the number three in destination for foreign investors. Let's see what they're saying. Well, definitely Florida, it's is a a location or is an area that attracts many of the international REALTORS®. I understand that Chicago as well. And I understand that obviously New York is is the greatest area to invest. I think last year, the year before, I would probably just said Florida and California, but now I'm going to say Florida and North Carolina. So Florida still probably number one, has been number one for a while, and I would take a guess hopefully California is number three. I think that the number one source or location for international investors I think would be Florida first. I think Florida's done a great job, and of course, there's a natural attraction to that lifestyle and that culture down in Florida. But I think it #3 I'm going to take a stab and say North Carolina, because we have worked really hard to show our presence abroad. And I think that we probably are the location that people are trying to get to because of the quality of life. While the vast majority of my global business is outgoing, it's no secret that for incoming investments, Florida is certainly a leader for specific investors. California, Texas, North Carolina and Arizona are all quite interesting to incomers. Florida is, as always that number one spot and they just have a magic formula for global and they are absolutely amazing. But yeah, the other states are there as well as Matt will tell us. Yes, exactly. So like, like Stephanie said, Florida is the number one spot. It's been the poster child of foreign investment in US residential real estate for 16 consecutive years of this study. That's largely led by Miami, which is a hotspot of foreign buyers, sort of brought in one in five foreign buyers last year. Amazing. Texas has increased a bit actually over the past couple of years, largely led by those Mexican buyers, and they've brought in 13% of foreign purchases. California has remained strong at 11%. Arizona has also remained strong at 5%. Georgia actually knocked out North Carolina from the top five this year, where and they rose a bit in the rankings to number to #5 with 4% of buyers. Yeah, I get the feeling that our foreign buyers are looking for sunshine and warm weather and you know they're not looking for the the 30 below Midwest. Yes, exactly, especially coming from Canada. So here are where those buyers are coming from. So we're looking at a regional breakdown here in Florida, that number one state largely led by Latin American and North American buyers. So a note here for this regional breakdown, while Mexico is part of North America for this regional breakdown, we include it in Latin America geographically. So North America leaves just Canada, Texas, their buyers are almost half of them coming from Latin America and almost a third coming from Asia. California buyers largely led by Asia, it's the majority of their buyers coming from that region. Arizona largely led by North America, meaning Canadian buyers, and Georgia has more of a spread between buyers coming from different regions of the world. Yeah, Georgia's kind of like level across the board, but you know, geographically, when you think about it, makes sense. Yeah, exactly. So how are they financing this purchase? We talked about price points. This is how they're financing it. So we talked about how 50% of foreign buyers purchased with all cash last year. Here you can see that since 2018, before this year, the US mortgage was actually the number one in the common way for these foreign buyers to finance their purchase of real estate. But this year it the all cash share shot up and half of them purchased with all cash. Here we can see how that compares to US buyers overall. So in the past couple of years, we've seen higher levels of all cash buyers in the US. We've seen largely homeowners that are already in homes and have experienced decades of the financial benefits and wealth gains of home ownership. They have the ability to use that extra equity, especially if they're moving to a more affordable state to purchase with all cash or they're purchasing an secondary or investment property. However, even with that, foreign buyers are purchasing with all cash in an even higher rate. Paying with all cash, they're able to avoid any confusion with you accessing AUS mortgage. They can more easily win a bidding battle against several other offers. They can avoid our mortgage rates and also they can more quickly jump on available inventory when it if and when it's available. And on the market here we can see some pretty big differences of all cash buyers between the countries of origin. So Canadian and Chinese buyers, at least 2/3 of them paid in all cash. And remember these are two of the biggest cohorts of foreign buyers. So they're really bringing up that all cash percentage, Mexican and Colombian buyers. They're just over two and five are paying in all cash. Remember they are at a slightly lower price point, making that possibly more feasible. Indian buyers, however, they had the second highest price point, only 27% paid in all cash. So they're much more often using AUS based mortgage to purchase their property, which will make more sense when we talk about how they're using those properties in a moment. But first, a little more from the panel. All right. So now again, we're getting more and more information as we're moving along here, but we asked our panelists what is inspiring the buyers they're working with to purchase in the US. So let's hear a little bit about why they're finding investors are investing in the US. And for the Chinese, we kind of came down three primary criteria. Three criteria. Number one, strangely, is education for their children. And funny story, we've had buyers that basically we, they say we want to buy something close to university or we want to buy something that's in our top ranked school district. And then we asked them, how old is your child? I'm not even married yet. So they're preppy way ahead of time. So number two is they want to kind of have their investments diversified because within China, if they keep everything there. And we see recently, of course, the Chinese economy is not doing well and that has definitely affected their real estate values. And the third thing is, is for lifestyle reasons. So in the United States, there's a lot of areas that do have kind of Chinese communities already set up. So they want to live kind of where where they're already welcomed. They don't have to have a huge transition or learning phase if they come over. Jobs are plentiful, nice home for that they can afford, and plenty of room to roam or near their own community. You know me, I I I'm a true believer of the American Dream. It doesn't matter what people continues to say that it disappeared, that it no longer exists. Millions of individuals immigrate to the United States in search and pursue of that American Dream. And for many, the American Dream is to own a piece of land in this country. So as REALTORS®, we actually help make that American dream a reality for many. OK when I first met with Dora, she she said that I just met. I, I, I teared up. Because if that is not, but that is not a testimonial for not only just getting involved in global and the fulfillment that you get, but just working for, you know, working with a REALTOR® and you know, the service that our members provide to everyone who's looking for their home that I just love it. So moving on. Absolutely great to hear. So we also look at what how these recent purchase, these purchasers plan to use their property that they purchased and with foreign buyers, it's very common for them to use this property as a vacation home, a rental or both where they rented out whenever they're not there. This has actually been a little bit elevated among US buyers over the past couple of years, again with folks building up equity and having the financial means to purchase a secondary or investment property. However, it's at a much higher level among foreign buyers at 45%. When we break this down by country of origin, you can see some big differences here. So in the darker green, you can see Canadians are largely purchasing sole vacation homes. They want a place that they can go to whenever they want and leave when they want and go back. Indian buyers, 2/3 of them are purchasing a primary residence. This makes more sense when we look at a higher price point and also the fact that they're financing the purchase with AUS Mortgage. It's because it's their primary residence. You're more likely to spend more on that primary residence. Colombian buyers in that light green, you can see two-thirds of them are purchasing investment rental properties. So they're seeing that it's a great investment alone to purchase property in the US, but then in the meantime they can generate some rental income as well. As far as property types, similar to US buyers, foreign buyers largely purchase detached single family homes. However, they also purchase condos and townhomes at higher rates than domestic buyers. Again, this makes a lot of sense when you're looking at people purchasing vacation homes and rentals. They want less maintenance, especially when they're not there to see it most of the year. However, wanted to point out resident buyers are much more likely than others to be purchasing detached single family homes again, for their primary residence and non residents are more likely to look at condos. It seems that there's a little bit more demand for condos and townhomes of that sort and those, you know, those rentals or vacation homes. Yes, exactly. And it also has to do with the types of areas they're purchasing. And there's definitely more availability of condos and townhomes as well. When we break down the property types by the country of origin, there's less variety here. They're primarily purchasing detached single family homes, which is most common among Indian buyers again purchasing those primary residences. Colombian buyers are much more likely to be purchasing a condominium again to be used as a rental. That's, that's a huge, huge difference there when you look at the different types of properties. But as you said, Matt, you know, when you're looking at them investing, you know, in especially Miami condo market is a great way for them to invest. So these numbers are great. Exactly. So also similar to US buyers, foreign buyers most often purchase in suburban areas. However, they purchase in central cities and urban areas at much higher rates than the typical US buyer as well. Again, if you think about it, they're they want a property to use as a vacation home or rental. They want it to be accessible for vacation purposes to make sure that they can easily get there to spend time there. But also, they want it to be in areas with higher rental demand, which happened to be in those population centers in cities and suburban areas. Here we see that breakdown. And again, we see some big differences here. Canadian buyers in the green, more than a third of them are purchasing in resort areas. Remember, they're primarily purchasing vacation homes and they're most often purchasing in Florida and Arizona. So they're purchasing in resort areas to spend their vacation time. Indian buyers again more than 3/4 purchasing in suburban area for their detached single family primary residence homes. And Columbian buyers, almost none are purchasing outside of cities and suburbs, again, they're purchasing in areas with higher rental demand. Yeah, you don't see a lot of rural condos. All right, time for an our last whole question. All right, pull question #3 get your answers ready, everyone. What was the most popular country in which US clients searched for property abroad last year? So we're we're looking at going outside of the US now, Matt. All right, wonderful. Well, I know where I'd want to go. So let's see where everyone else thinks the majority of the US residents want to go. Looking good. Give you a few more seconds here. Locking your answers. All right, hey, and the verdict is it is Mexico. Yes, So we will talk a little bit more about this in just a second, but this is the top location that US clients are looking to purchase property abroad. That's awesome, that makes sense. It's nice and close. It's beautiful. Exactly. Food is great. So before we to talk about that, we talked a lot about the successful foreign buyers, but we also want to touch on the unsuccessful foreign buyers just to show all of the demand that's still out there and the opportunities that there are for you to to grab onto. So we asked respondents to the survey and 64% of them said that they had they were working with international clients that simply decided or not to or were unable to make a purchase. The main reasons that are holding them back are the same barriers like I've said, that US buyers are dealing with. They either cannot find a property to purchase or it simply doesn't fit in their budget. They're dealing with very low inventory and high cost that inventory is we just need to compete more houses. Yes, exactly. And with more inventory hitting the market more recently and still to come, there is more opportunity for more of these buyers to enter the market. They will be however, competing against a lot of the built up domestic demand as well. But there's plenty of opportunity out there. I'm excited to see you at the 2025 report says absolutely. So here we're looking at, like we mentioned in the poll question, US clients looking at property abroad. So in a way the opposite direction of what we've been talking about. And what we saw was about a tenth of respondents said they had AUS clients that were hoping to purchase property abroad. When we look at what they want property for, the number one reason was to use as a vacation home and rental so they can spend their vacation time there and also generate rental income and help pay for that property when they're not there. Vacation homes are also up there as the number two option. Who doesn't love a vacation home and a place to go to whenever you want? About 1/5 are looking at ways to purchase abroad to have a rental home and again, have an investment that builds itself in value but also brings in rental income. And 17% said I'm out of here, I want to purchase a primary residence abroad and move there. But in recent years, we've seen more US clients looking at these vacation homes or dual vacation home rentals, especially with the prominence of remote work. Even if you have to log on while you're there, if you're in a beautiful sunny location, it can still feel like vacation. I can tell you I'd rather work from a hammock than ice and snow. I mean, that's if I log on. And, you know, it's, it's really cool to see how digital nomads have kind of changed that whole landscape there. And you know, and especially, you know, these again, are opportunities where, you know, even though they're leaving the US and they're purchasing abroad, you know, especially for those ones that are like, hey, I'm out of here. You know, these are opportunities for you to get that listing and then also to work with one of our international real or REALTOR® members and send that referral. You know, find ACI, yes, find an IRM who's in one of those countries that your buyer is looking at and you know, get to get that referral. So lots and lots of opportunities all over. Absolutely. And in all these transactions, people from in the US and outside benefit from that transaction. So it's really opportunity all around. Absolutely. And as far as they're looking, where they're looking, we saw Mexico's the number one location, but that's followed by Costa Rica, Italy, Colombia and Spain, just so happen to have REALTOR® members and all of those places. Perfect. And finally, we like to look at where REALTORS® are finding this business, where are they getting their leads and referrals to work with these international clients. 72% of these leads and referrals come from personal and business clients and contacts. So you can see the top two sources of these leads and referrals are that they were referred by a prior client or that their personal contacts of the REALTOR® followed by being a former client. So repeat business. So this tells us REALTORS® are providing excellent service given that they're getting repeat business and also referrals. But it also really emphasizes the importance to build, grow and maintain your network for referrals and any possible clients and especially through opportunities like your global councils. Absolutely. You know, I mean, real estate is a relationship business and building those relationships and you know, nurturing that network and you know, that's, that can make a break you. So I love seeing that it's not just for domestic, it's it's worldwide. So keep building those global networks. All right, So now we have a lot of information. We've seen where the opportunities are. We asked our experts what resources does NAR have available to choose only one resource. It would probably be the most underused but most valuable global resource that NAR offers. The research resources. We have so much information available at our fingertips. Or just an e-mail away. I could do an entire class on how to grow your global business using NAR research resources. Seriously close behind that would probably be the assistance and network of global councils and networks we have at our disposal. In my local market. Our global network is a newbie and we relied heavily on other more established councils like our friends in Austin at a War Global and also in Chicago. They were helpful in getting our networks up and running. Some of us just view international investment or clients as a distant situation. So by connecting with your Global Business Council, you realize that is something that is here, that is here to stay and that is not that difficult. And that they are all the people or all the colleagues that are very successful in the international business. So it's a way of motivating, but it's also a way of having the networking necessary to actually embark in the business. And they are global as just a department within an AR, I think has been very, very helpful and supportive for kind of all of us, whether it's at the state level or the local level. And then all of us individually as real estate practitioners wanting to be more involved or be more educated has supported kind of these goals. At the national conferences, a platform is provided where we have we get to meet people, see, reconnect with people we haven't seen since the last conference and we have the CIPS night out and that's a wonderful event. We have pinning ceremonies for new designees and networking events. So it's all about increasing our business and making connections and that's not something we have to do. We don't have to go on a trade mission to do that. We just go to the conference, which hopefully we'll be at anyway. I think if we look at the tools that have been instrumental for me as I got into the global arena, I think having our state association be so supportive and educating our members about what it is to work in the global arena. That was the first thing I remembered that if you look at specific tools that really catapulted my knowledge base, it was having the opportunity to take the Certified International Property Specialist designation. When I did that, it gave me a whole different level of scope of what the opportunities were for me to be able to get in this arena and to work in this vein of real estate. And I think one other designation that actually works with that that has helped me is the At Home with Diversity. You know, the At Home with Diversity works in tandem with understanding cultures and different people around you that work in different spaces, the differences that we have and to embrace that. And once we do, it helps with understanding other cultures outside of us. So, you know, I think that those are the two designations that I think that I would recommend that would catapult you. But I think first and foremost, if you're going to continue to educate yourself about what's happening in an international market, and you want to be in this world of real estate, working with this arena, you've got to study the International Transactions of US Real Estate report. This report really gives you a better understanding of what investments coming in the United States, what areas of the United States it's going into. And so I read that like religion when it comes out. So those are the things that I think really are important for me. And of course, the international buyer report from NAR is one of the key metrics we use every year. Everyone says there's no shortcuts in life. This, I think, is a good shortcut. Well said, Spencer. Yes, good shortcut. And you know, Matt, I think we're hearing a lot. You know, we're hearing a lot of love for CIPS, for our education, for getting involved through global business councils, and especially for the research. So I love that our members are using the resources that we have here. Absolutely. So we're going to check to see if there's some final questions. OK. So one of the questions is asking about Asia, Oceania in the regional breakdown. So that is a general group of countries in that entire region. That is not obviously a specific country, but a group in that region of the world. Someone asked, are foreign buyers buying raw land or lots? Yes, in one of the property types that we covered in the report is residential land. So that that would fit into that category if they're buying land to then develop in a residential capacity afterwards. All right. And so then we also have, it's my understanding that 10,000 Americans moved to Portugal last year. I'm surprised that Portugal is not showing up in your data. It actually was. So we showed you the top ten. Portugal was in the top or sorry, we showed you the top five. Portugal is in the top ten. I want to say it was just out of the top five at six or seven. Portugal's hot. It's it's on fire lately. So yes, yes. Will there be programs for CIPS Global at C5 that I'm not sure I can follow up on that. I would say if you visit the NAR website and the C5 specific information, I believe they're adding programming all the time. But feel free to reach out to me and I can connect you with whoever may be able to answer that. So another question is what is your outlook for foreign investment in the US for 2024? This. I wish I had a crystal ball to give you the answer for this. Like I showed towards the end, there's plenty of pent up demand of foreign buyers. There's 64% of respondents had international clients that wanted to make a purchase and did not. They're simply not finding enough homes. However, the root cause to that problem is inventory. We have more inventory hitting the market, which can bring more foreign buyers. However, they will be competing against a lot of pent up domestic demand as well. So it'll be interesting to see who wins out that battle for the inventory coming to the market. Yeah, absolutely. And I see there's a few more questions and, you know, we'll get to those. We'll follow up with everyone. We have a few, just a few more things we want to be able to share with you. We know everyone is on time restraints and off to appointments. We want to be respectful of that. But feel free, of course, to reach out to us and we're always happy to keep sharing that information. Yes. And we'll also have our emails included in this, so anybody can reach out with any additional questions. Absolutely. So I do want to just end this. We have, again, just a little bit more contact information after this. But you know, I asked our panelists, you know, after all of this, what does global mean to you? Like what, what, what does it mean to them? How does it hit them? How does it hit their business? And you know, let's see what they have to say. You know, global to me, if you ask me what global means, if you look at the true definition of global, it really is about embracing the whole of something. And we have to remember that global is more than just what we think of when we hear that word. It's not just international, but it's the whole of everything. And when we think of diversity and we think of who makes up our communities, our communities are a true blueprint of the globe and of the world ethnicities and and different walks of life. And so local is global. And it's also a broader scope of those who are coming in from all parts of the world. Inbound and outbound real estate transactions both do count as global. And when we speak with a lot of our clients or our colleagues, many don't understand that it is a bi directional type of a deal. So we we kind of correct them unfortunately and say, you know, you've been doing global business already. Well, global to me means that I am able to be a part of connecting all the dots that we see on the globe, around the globe. And it is just wonderful to travel to different countries and learn about how they do real estate there. Learn from an international member, international REALTOR® member. Global to me means the future. It, it means that now with technology, we, we can interact with buyers and, and investors everywhere in the world. It seems like it's we're working towards a future where borders are disappearing and we can now buy properties anywhere in the world, even without visiting the property. Global allows us to communicate, to state, to connect and to transact in a unprecedented manner and scale. And I think that we as REALTORS® are ready to take that challenge. For me, global real estate is the lifeblood of my business. It will and can transform real estate as we know it. And I believe that every agent should have a global segment of their business. Global to me is kind of everything, I think. And that right there, global is everything. It's it's close to all of our hearts. That's why we're all here, let's be honest. So again, I want to thank all of our amazing panelists for contributing their time today. Again, I'll be sharing all the recordings and the follow up so you'll get to see more. I may include some extra bonus information there too. But here's the contact information for our amazing panelists if you want to reach out to them and get more information. Also, of course, I'll have the link at the end here, but for country specific information or if you're looking for more information, if you're setting up a trade mission or a trip or anything else, reach out to our global ambassadors. That's what they're there for. They are really the experts when it comes to making those connections and getting that information. So that's why they're there on some of the references that we made here. So we have the global Facebook and LinkedIn, NAR and Espanol, which is an excellent resource. CIPS, I think we might have heard CIPS once or twice during this call, the NAR Global and then all of the the wonderful research that is available. Our research team works so hard. And you know, Matt, I just want to give a special thank you to you and Meredith and the entire team, you know, Lawrence and Jessica and I mean, we, we couldn't do what we do without research. So thank you so much. But again, here are some of the frequent visited links here. So moving on. All right, so I want to thank you for joining us. And of course, if you have any questions, if you want to set up a council, if you just just want to say hi or connect about something relating to global, feel free to reach out. The QR code here is to the to the international report and I will turn it over to Matt. Yes. So a final thank you to Stephanie and the global team and also to Meredith for helping us answer all of your great questions. Thank you all for joining today and getting involved, and we'll hear and speak more soon. a#white-header:hover{color: white; background-color: #35a0ea; display: inline;} " data-src="https://cdn.nar.realtor/sites/default/files/styles/inline_paragraph_image/public/youtube-icon-45w32h.png?itok=CKtHOzk_" class="b-lazy" width="45" height="32" alt="YouTube Play Button Icon"> NAR Videos on YouTube NAR offers additional topics online covering legislation, events, industry news and guides for both NAR members and the public. Visit NAR on YouTube National Association of REALTORS® 25.6K subscribers Open YouTube REALTOR® Party 1.82K subscribers Open YouTube REALTOR® Magazine 3.96K subscribers Open YouTube NAR Meetings 1.85K subscribers Open YouTube Realtors Property Resource® (RPR) 13.4K subscribers Open YouTube HouseLogic 1.46K subscribers Open YouTube First-Time Buyer 3.7K subscribers Open YouTube That’s Who We R (playlist) Open YouTube
Read MoreInstant Reaction: Jobs, August 2, 2024
Mortgage rates are plunging on the news of weak job growth and rising unemployment. The 4.3% unemployment rate is the highest since coming out of the COVID lockdown and higher than the 3.5% unemployment rate right before the COVID-19 arrival. The hourly wage gain of 3.2% is the weakest in 3 years. The Fed was late moving away from the restrictive monetary policy stance when early signs of a softening economy were visible. Soft manufacturing survey data, falls in construction activity, and damaging financing costs for small businesses clearly hint at a cooling economy and further cooling in inflation. The Fed may make a deeper cut of 50 basis points in September. The 30-year fixed mortgage rate looks to fall to 6.5% or even lower in the upcoming weeks. That is what the 10-year bond yield suggests, which plunged to 3.8% this morning, compared to 4.8% a few months ago. The 100-basis-point change in mortgage rates generally means around a $300 lower payment on a typical mortgage. Homebuyers who were priced out a few months ago should re-check whether they can enter the homebuying market if they have secure jobs. " data-src="https://cdn.nar.realtor/sites/default/files/styles/inline_paragraph_image/public/economists-outlook-total-payroll-jobs-january-2020-to-july-2024-bar-graph-08-02-2024-1280w-720h.png?itok=F9ZLEFbC" class="b-lazy" width="1200" height="675" alt="Bar graph: Total Payroll Jobs, January 2020 to July 2024" title="Bar graph: Total Payroll Jobs, January 2020 to July 2024"> " data-src="https://cdn.nar.realtor/sites/default/files/styles/inline_paragraph_image/public/economists-outlook-monthly-net-payroll-job-additions-january-2022-to-july-2024-bar-graph-08-02-2024-1280w-720h.png?itok=hwFcFfjG" class="b-lazy" width="1200" height="675" alt="Bar graph: Monthly Net Payroll Job Additions, January 2022 to July 2024" title="Bar graph: Monthly Net Payroll Job Additions, January 2022 to July 2024"> " data-src="https://cdn.nar.realtor/sites/default/files/styles/inline_paragraph_image/public/economists-outlook-unemployment-rate-january-2020-to-july-2024-line-graph-08-02-2024-1280w-720h.png?itok=EKj4Q4wo" class="b-lazy" width="1200" height="675" alt="Line graph: Unemployment Rate, January 2020 to July 2024" title="Line graph: Unemployment Rate, January 2020 to July 2024"> " data-src="https://cdn.nar.realtor/sites/default/files/styles/inline_paragraph_image/public/economists-outloook-job-gains-from-march-2020-to-june-2024-us-map-08-02-2024-1280w-720h.png?itok=neQvLKys" class="b-lazy" width="1200" height="675" alt="U.S. Map: Job Gains from March 2020 to June 2024" title="U.S. Map: Job Gains from March 2020 to June 2024">
Read MoreContract Signings Rise as More Listings Hit the Market
" data-src="https://cdn.nar.realtor/sites/default/files/styles/inline_paragraph_image/public/gettyimages-1166187606.jpg?itok=sHTn3o8s" class="b-lazy" width="1200" height="580" alt="Real estate agent shaking hands with clients inside home"> © monkeybusinessimages - iStock/Getty Images Plus Home buyers have more housing choices this summer, and home sellers may find stiffer competition on the market. Pending home sales rose nearly 5% in June as more house hunters went under contract for a home purchase. All four major regions of the U.S. posted monthly gains in transactions, according to the National Association of REALTORS®’ Pending Home Sales Index, a forward-looking indicator of home sales based on contract signings. “The rise in housing inventory is beginning to lead to more contract signings,” says NAR Chief Economist Lawrence Yun. “Multiple offers are less intense, and buyers are in a more favorable position.” Still, home buyers are contending with high home prices: The median price for an existing home surged to an all-time high of $426,900 in June. Mortgage rates also escalated to averages near 7% last month, heightening borrowing costs. But as of last week, rates had dialed back to an average of 6.78%, according to Freddie Mac. Buyers are showing resilience in their homeownership journey. NAR economists recently pointed to growing opportunities in the housing market for real estate professionals, noting where inventory is rising in the country. “Even more inventory is expected to come onto the housing market in the upcoming months ahead of the normal, seasonal declines in the winter,” Yun notes. “The Northeast’s small gain in contract signings is due to the ongoing housing shortage situation in that region, leading to stronger home price gains. It is a good time to list.” " data-src="https://cdn.nar.realtor/sites/default/files/styles/inline_paragraph_image/public/nar-june_2024-phs.png?itok=mWR1dbue" class="b-lazy" width="1000" height="1501" alt="NAR's June Pending Home Sales Index"> Subscribe to E-Newsletters Reprints About Us Contact REALTOR® Magazine
Read MorePending Home Sales Rose 4.8% in June
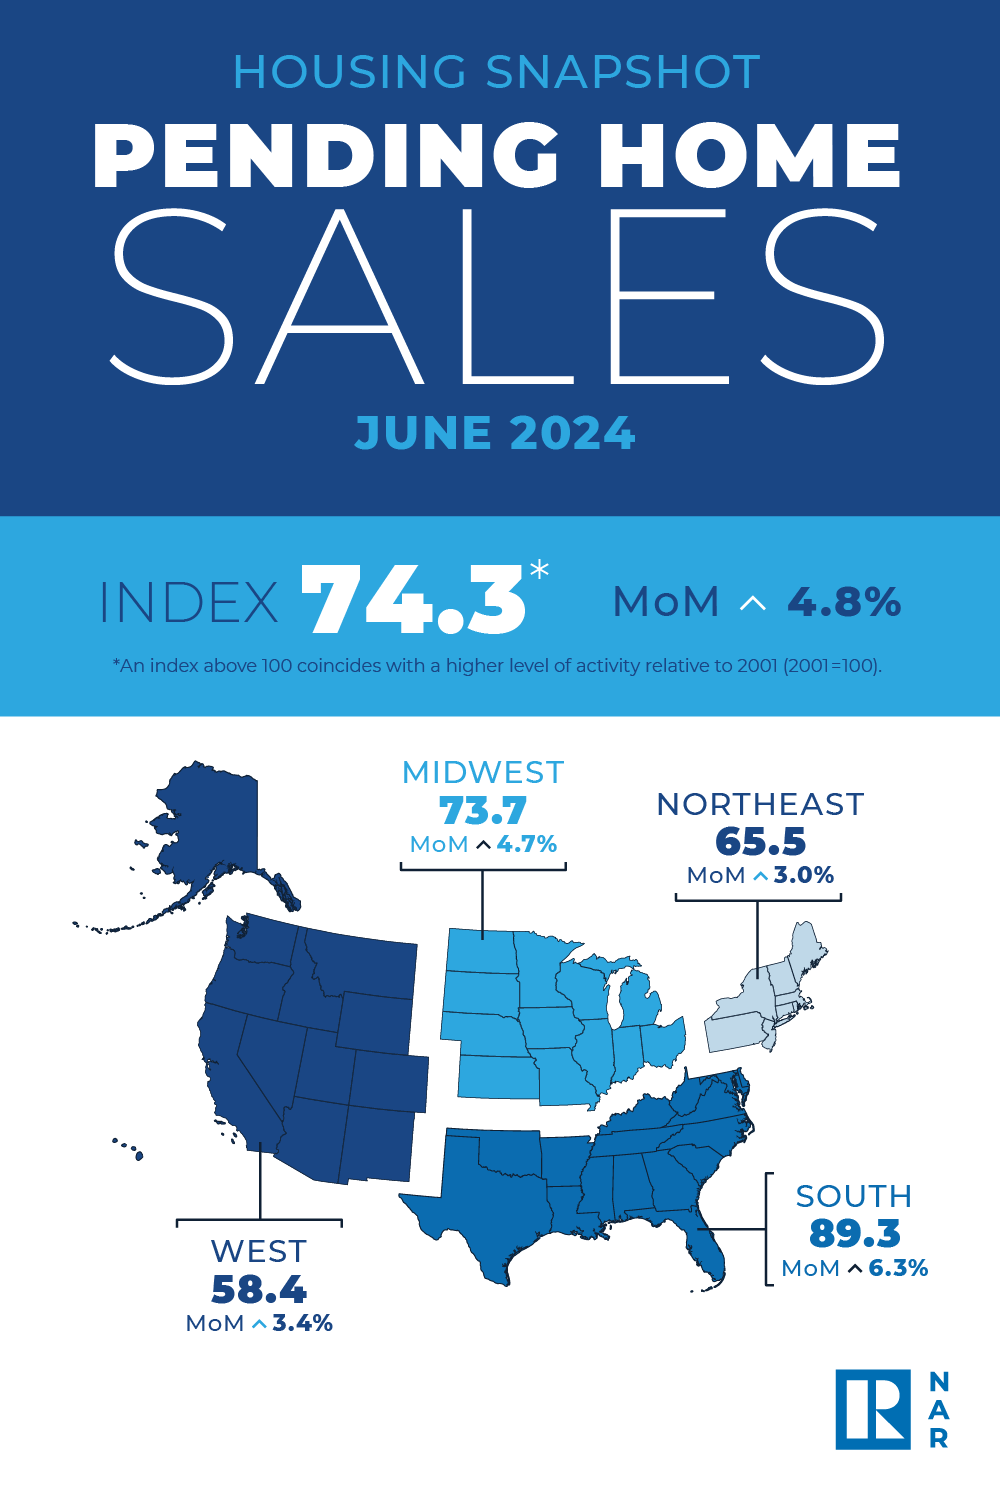
Key Highlights Pending home sales intensified 4.8% in June. Month over month, contract signings increased in all four U.S. regions. Compared to one year ago, pending home sales declined in the Northeast, Midwest and South, but improved in the West. " data-src="https://www.nar.realtor/sites/default/files/styles/inline_paragraph_image/public/downloadable/2024-06-pending-home-sales-housing-snapshot-infographic-07-31-2024-1000w-1500h.png?itok=koTy0gJg" class="b-lazy" width="1000" height="1501" alt="Pending Home Sales Snapshot Infographic, June 2024" title="Pending Home Sales Snapshot Infographic, June 2024"> See and share this infographic. WASHINGTON (July 31, 2024) – Pending home sales in June ascended 4.8%, according to the National Association of REALTORS®. All four U.S. regions posted monthly gains in transactions. Year-over-year, the Northeast, Midwest and South registered declines, while the West increased. The Pending Home Sales Index (PHSI)* – a forward-looking indicator of home sales based on contract signings – grew to 74.3 in June. Year over year, pending transactions were down 2.6%. An index of 100 is equal to the level of contract activity in 2001. "The rise in housing inventory is beginning to lead to more contract signings," said NAR Chief Economist Lawrence Yun. "Multiple offers are less intense, and buyers are in a more favorable position." Pending Home Sales Regional Breakdown The Northeast PHSI ascended 3.0% from last month to 65.5, a decline of 0.3% from June 2023. The Midwest index rose 4.7% to 73.7 in June, down 4.2% from one year ago. The South PHSI increased 6.3% to 89.3 in June, dropping 3.9% from the prior year. The West index climbed 3.4% in June to 58.4, up 1.0% from June 2023. "Even more inventory is expected to come onto the housing market in the upcoming months ahead of the normal, seasonal declines in the winter," added Yun. "The Northeast's small gain in contract signings is due to the ongoing housing shortage situation in that region, leading to stronger home price gains. It is a good time to list." About the National Association of REALTORS® The National Association of REALTORS® is America's largest trade association, representing 1.5 million members involved in all aspects of the residential and commercial real estate industries. The term REALTOR® is a registered collective membership mark that identifies a real estate professional who is a member of the National Association of REALTORS® and subscribes to its strict Code of Ethics. # # # *The Pending Home Sales Index is a leading indicator for the housing sector, based on pending sales of existing homes. A sale is listed as pending when the contract has been signed but the transaction has not closed, though the sale usually is finalized within one or two months of signing. Pending contracts are good early indicators of upcoming sales closings. However, the amount of time between pending contracts and completed sales is not identical for all home sales. Variations in the length of the process from pending contract to closed sale can be caused by issues such as buyer difficulties with obtaining mortgage financing, home inspection problems, or appraisal issues. The index is based on a sample that covers about 40% of multiple listing service data each month. In developing the model for the index, it was demonstrated that the level of monthly sales-contract activity parallels the level of closed existing-home sales in the following two months. An index of 100 is equal to the average level of contract activity during 2001, which was the first year to be examined. By coincidence, the volume of existing-home sales in 2001 fell within the range of 5.0 to 5.5 million, which is considered normal for the current U.S. population. NOTE: Existing-Home Sales for July will be released August 22. The next Pending Home Sales Index will be released August 22. All release times are 10 a.m. Eastern. View the NAR Statistical News Release Schedule.
Read MoreInstant Reaction: Mortgage Rates, July 25, 2024
Facts: The 30-year fixed mortgage rate from Freddie Mac was nearly unchanged at 6.78% this week vs 6.77% last week. At 6.78%, with 20% down, a monthly mortgage payment on the median priced existing home of $426,900 is $2,222; with 10% down, it is $2,500. Positive: Also out today: GDP was stronger than expected. However, the PCE price index, which the Fed is watching, increased 2.6% for Q2, down from 3.4% in Q1. Under more Fed scrutiny, Core PCE rose 2.9%, down from 3.7%. Monthly PCE is out tomorrow. Negative: There is a divide among consumers who are spending, and those still feeling the strain of inflation. When the FOMC meets next week, this will probably still not be enough to lower the Fed Funds Rate and they will likely hold until September.
Read More-
According to NAR's Housing Affordability Index, housing affordability declined nationally in May compared to the previous month. The monthly mortgage payment increased by 3.9%, while the median price of single-family homes rose by 5.7% (from $401,500 to $424,500) year-over-year. The monthly mortgage payment increased by $87 from last month. Compared to one year ago, affordability fell in May as the monthly mortgage payment climbed 12.7% and median family income rose by 5.3%. The effective 30-year fixed mortgage rate was 7.14% this May compared to 6.51% one year ago. Nationally, mortgage rates were up 63 basis points from one year ago (one percentage point equals 100 basis points). Mortgage rates moved above 7% for the second time since last year (November 2023). The median existing-home sales price rose by 5.8% to $419,300 compared to one year ago ($396,500). " data-src="https://cdn.nar.realtor/sites/default/files/styles/inline_paragraph_image/public/economists-outlook-housing-affordability-index-may-2023-to-may-2024-line-graph-07-24-2024-1300w-602h.png?itok=w0ltEThJ" class="b-lazy" width="1200" height="556" alt="Line graph: Housing Affordability Index, May 2023 to May 2024" title="Line graph: Housing Affordability Index, May 2023 to May 2024"> " data-src="https://cdn.nar.realtor/sites/default/files/styles/inline_paragraph_image/public/economists-outlook-median-family-income-vs-qualifying-income-may-2023-to-may-2024-line-graph-07-24-2024-1300w-602h.png?itok=-sa7X9n2" class="b-lazy" width="1200" height="556" alt="Line graph: Median Family Income vs Qualifying Income, May 2023 to May 2024" title="Line graph: Median Family Income vs Qualifying Income, May 2023 to May 2024"> The national index is currently below 100, which means that the typical family cannot afford to buy based on the median-priced home. An index below 100 means that a family with a median income had less than the income required to afford a median-priced home. The income required to afford a mortgage, or the qualifying income, is the income needed so that mortgage payments on a 30-year fixed mortgage loan with a 20% down payment account for 25% of family income. The most affordable region was the Midwest, with an index value of 120.3 (median family income of $99,752 with a qualifying income of $82,896). The least affordable region remained the West, where the index was 66.8 (median family income of $111,727 and the qualifying income of $167,136). The South was the second most affordable region with an index of 95.7 (median family income of $94,272 and the qualifying income of $98,544). The Northeast was the second most unaffordable region with an index of 90.5 (median family income of $114,506 with a qualifying income of $126,528). A mortgage is affordable if the mortgage payment (principal and interest) amounts to 25% or less of the family’s income. " data-src="https://cdn.nar.realtor/sites/default/files/styles/inline_paragraph_image/public/economists-outlook-mortgage-rates-may-2023-to-may-2024-bar-graph-07-24-2024-1300w-628h.png?itok=N_tbChLJ" class="b-lazy" width="1200" height="580" alt="Bar graph: Mortgage Rates, May 2023 to May 2024" title="Bar graph: Mortgage Rates, May 2023 to May 2024"> " data-src="https://cdn.nar.realtor/sites/default/files/styles/inline_paragraph_image/public/economists-outlook-us-and-regional-housing-affordability-may-2024-and-may-2023-bar-graph-07-24-2024-1300w-583h.png?itok=6jrIf2Td" class="b-lazy" width="1200" height="538" alt="Bar graph: U.S. and Regional Housing Affordability, May 2024 and May 2023" title="Bar graph: U.S. and Regional Housing Affordability, May 2024 and May 2023"> " data-src="https://cdn.nar.realtor/sites/default/files/styles/inline_paragraph_image/public/economists-outlook-us-and-regional-median-family-income-and-qualifying-income-may-2024-bar-graph-07-24-2024-1300w-627h.png?itok=_I91pUio" class="b-lazy" width="1200" height="579" alt="Bar graph: U.S. and Regional Median Family Income and Qualifying Income, May 2024" title="Bar graph: U.S. and Regional Median Family Income and Qualifying Income, May 2024"> Housing affordability declined in all four regions from a year ago. The Northeast region experienced the biggest decline, 10.1%, followed by the Midwest, which dipped 7.1%. The West experienced a weakening in price growth of 5.9%, followed by the South, which fell 4.1%. Affordability fell in all four regions from last month. The Midwest region had the biggest decline of 4.8%, followed by the Northeast with a fall of 4.4%. The South had a decrease of 2.2%, and the West had the smallest reduction of 0.7%. Compared to one year ago, the monthly mortgage payment rose to $2,291 from $2,032, an increase of 12.7%. A year ago, the monthly mortgage payment increased by $259. The annual mortgage payment as a percentage of income inclined to 26.9% this May from 25.1% from a year ago. Regionally, the West has the highest mortgage payment to income share at 37.4% of income. The Northeast had the second-highest share at 27.6%, followed by the South at 26.1%. The Midwest had the lowest mortgage payment as a percentage of income at 20.8%. Mortgage payments are not burdensome if they are no more than 25% of income. " data-src="https://cdn.nar.realtor/sites/default/files/styles/inline_paragraph_image/public/economists-outlook-monthly-mortgage-payments-may-2023-to-may-2024-line-graph-07-24-2024-1300w-663h.png?itok=MSm6BtDR" class="b-lazy" width="1200" height="612" alt="Line graph: Monthly Mortgage Payments, May 2023 to May 2024" title="Line graph: Monthly Mortgage Payments, May 2023 to May 2024"> " data-src="https://cdn.nar.realtor/sites/default/files/styles/inline_paragraph_image/public/economists-outlook-median-home-prices-may-2023-to-may-2024-line-graph-07-24-2024-1300w-665h.png?itok=kxvAat4M" class="b-lazy" width="1200" height="614" alt="Line graph: Median Home Prices, May 2023 to May 2024" title="Line graph: Median Home Prices, May 2023 to May 2024"> Home prices are still outpacing median family incomes. Mortgage rates have been above 7% for two consecutive months. Coming back down below 7% will certainly be helpful to potential home buyers. Last week, the Mortgage Bankers Association reported that mortgage applications decreased 2.6% from one week prior. Housing inventory is increasing, so that is a good sign for potential home buyers. Read the full data release. The Housing Affordability Index calculation assumes a 20% down payment and a 25% qualifying ratio (principal and interest payment to income). See further details on the methodology and assumptions behind the calculation.
Read More -
" data-src="https://cdn.nar.realtor/sites/default/files/styles/wysiwyg_small2/public/2024-06-foot-traffic-sentrilock-home-showings-report-cover-07-23-2024-300w-400h.png?itok=zilgSYnu" class="b-lazy" width="200" height="267" alt="Cover of the June 2024 Foot Traffic NAR Sentrilock Home Showings report" title="Cover of the June 2024 Foot Traffic NAR Sentrilock Home Showings report"> Download PDF Home Showings in the U.S. in June 2024 Showings up 2% Year-over-Year in June June 2024 U.S. showings were up 2% year-over-year, with 782,035 showings, according to data from SentriLock, LLC., a lockbox company. The pace of showing activity has inclined compared to last month, May 2024. SentriLock Cards Increased 3% Year-over-Year Total U.S. SentriLock cards rose3% year-over-year to 234,129. SentriLock cards, comprised of SentriKey® and SentriCard®,allow REALTORS® to access the Sentrilock® lockbox and indicate the number of REALTORS® who conduct the showing. Showings Per Card Decreased to -1% Year-over-Year The number of showings per card reflects the strength of buyer interest per listed property. At a national level, showings per card decreased to -1% year-over-year in June. " data-src="https://cdn.nar.realtor/sites/default/files/styles/inline_paragraph_image/public/2024-06-foot-traffic-us-year-over-year-change-in-home-showings-january-2009-to-june-2024-line-graph-07-23-2024-566w-294h.png?itok=kCty1lb_" class="b-lazy" width="566" height="294" alt="Line graph: U.S. Year-Over-Year Change in Home Showings, January 2009 to June 2024" title="Line graph: U.S. Year-Over-Year Change in Home Showings, January 2009 to June 2024"> Regional Home Showings in June 2024 One of the Four Regions Saw Year-over-Year Showings Increase Two of the four regions saw an increase in showings on a year-over-year basis in June: The Northeast had the biggest gain (34%), followed by the South (8%). The West region was flat (0%). Showings were down in the Midwest (-6%). Year-over-Year SentriLock Cards Decreased in Two of the four Regions Cards were up in the South (10%) and the Northeast (7%) on a year-over-year basis. The West fell (-3%), followed by the Midwest (-1% ), which had the smallest decline. Showings Per Card Increased in Two of the Four Regions on a Year-over-Year Basis Two of the four regions saw year-over-year increases in showings per card in June. The Northeast had the biggest increase(25%),followed by the West (4%). The South fell (2%), followed by the Midwest region, which declined (5%). " data-src="https://cdn.nar.realtor/sites/default/files/styles/inline_paragraph_image/public/2024-06-foot-traffic-regional-year-over-year-change-in-home-showings-us-map-07-23-2024-522w-334h.png?itok=O1icfQGj" class="b-lazy" width="522" height="334" alt="U.S. Map: Regional Year-Over-Year Change in Home Showings June 2024" title="U.S. Map: Regional Year-Over-Year Change in Home Showings June 2024"> Download the full report
Read More July 2024 NAR Real Estate Forecast Summit: Residential Update
On July 22, 2024, from 12:00 – 1:00 p.m. ET, NAR held a virtual economic and real estate summit that provided an outlook on the changing residential real estate market. The speakers were NAR Chief Economist Lawrence Yun and NAR Deputy Chief Economist Jessica Lautz. a#white-header:hover{color: white; background-color: #35a0ea; display: inline;} " data-src="https://cdn.nar.realtor/sites/default/files/styles/inline_paragraph_image/public/youtube-icon-45w32h.png?itok=CKtHOzk_" class="b-lazy" width="45" height="32" alt="YouTube Play Button Icon"> NAR Videos on YouTube NAR offers additional topics online covering legislation, events, industry news and guides for both NAR members and the public. Visit NAR on YouTube National Association of REALTORS® 25.6K subscribers Open YouTube REALTOR® Party 1.82K subscribers Open YouTube REALTOR® Magazine 3.96K subscribers Open YouTube NAR Meetings 1.85K subscribers Open YouTube Realtors Property Resource® (RPR) 13.4K subscribers Open YouTube HouseLogic 1.46K subscribers Open YouTube First-Time Buyer 3.7K subscribers Open YouTube That’s Who We R (playlist) Open YouTube
Read MoreExisting-Home Sales Slipped 5.4% in June; Median Sales Price Jumps to Record High of $426,900
Key Highlights Existing-home sales faded 5.4% in June to a seasonally adjusted annual rate of 3.89 million. Sales also slumped 5.4% from one year ago. The median existing-home sales price bounced 4.1% from June 2023 to $426,900 – the second straight month it reached an all-time high and the twelfth consecutive month of year-over-year price gains. The inventory of unsold existing homes rose 3.1% from the previous month to 1.32 million at the end of June, or the equivalent of 4.1 months' supply at the current monthly sales pace. " data-src="https://www.nar.realtor/sites/default/files/styles/inline_paragraph_image/public/downloadable/2024-06-existing-home-sales-housing-snapshot-infographic-07-23-2024-1000w-1500h.png?itok=_CTEgEof" class="b-lazy" width="1000" height="1501" alt="EHS Housing Snapshot Infographic, June 2024" title="EHS Housing Snapshot Infographic, June 2024"> See and share this infographic. WASHINGTON (July 23, 2024) – Existing-home sales fell in June as the median sales price climbed to the highest price ever recorded for the second consecutive month, according to the National Association of REALTORS®. All four major U.S. regions posted sales declines. Year-over-year, sales waned in the Northeast, Midwest and South but were unchanged in the West. Total existing-home sales1 – completed transactions that include single-family homes, townhomes, condominiums and co-ops – receded 5.4% from May to a seasonally adjusted annual rate of 3.89 million in June. Year-over-year, sales also dropped 5.4% (down from 4.11 million in June 2023). “We're seeing a slow shift from a seller's market to a buyer's market,” said NAR Chief Economist Lawrence Yun. “Homes are sitting on the market a bit longer, and sellers are receiving fewer offers. More buyers are insisting on home inspections and appraisals, and inventory is definitively rising on a national basis.” Total housing inventory2 registered at the end of June was 1.32 million units, up 3.1% from May and 23.4% from one year ago (1.07 million). Unsold inventory sits at a 4.1-month supply at the current sales pace, up from 3.7 months in May and 3.1 months in June 2023. The last time unsold inventory posted a four-month supply was May 2020 (4.5 months). The median existing-home price3 for all housing types in June was $426,900, an all-time high and an increase of 4.1% from one year ago ($410,100). All four U.S. regions registered price gains. “Even as the median home price reached a new record high, further large accelerations are unlikely,” Yun added. “Supply and demand dynamics are nearing a balanced market condition. The months supply of inventory reached its highest level in more than four years.” REALTORS® Confidence Index According to the monthly REALTORS® Confidence Index, properties typically remained on the market for 22 days in June, down from 24 days in May but up from 18 days in June 2023. First-time buyers were responsible for 29% of sales in June, down from 31% in May but up from 27% in June 2023. NAR's 2023 Profile of Home Buyers and Sellers – released in November 20234 – found that the annual share of first-time buyers was 32%. All-cash sales accounted for 28% of transactions in June, unchanged from May and up from 26% one year ago. Individual investors or second-home buyers, who make up many cash sales, purchased 16% of homes in June, identical to May and down from 18% in June 2023. Distressed sales5 – foreclosures and short sales – represented 2% of sales in June, unchanged from last month and the previous year. Mortgage Rates According to Freddie Mac, the 30-year fixed-rate mortgage averaged 6.77% as of July 18. That's down from 6.89% one week ago and 6.78% one year ago. Single-family and Condo/Co-op Sales Single-family home sales retracted to a seasonally adjusted annual rate of 3.52 million in June, down 5.1% from 3.71 million in May and 4.3% from the prior year. The median existing single-family home price was $432,700 in June, up 4.1% from June 2023. Existing condominium and co-op sales tumbled 7.5% in June to a seasonally adjusted annual rate of 370,000 units, down 14% from one year ago (430,000 units). The median existing condo price was $371,700 in June, up 2.6% from the previous year ($362,200). Regional Breakdown Existing-home sales in the Northeast in June withdrew 2.1% from May to an annual rate of 470,000, a decline of 6% from June 2023. The median price in the Northeast was $521,500, up 9.7% from one year earlier. In the Midwest, existing-home sales decreased 8% from one month ago to an annual rate of 920,000 in June, down 6.1% from the prior year. The median price in the Midwest was $327,100, up 5.5% from June 2023. Existing-home sales in the South slid 5.9% from May to an annual rate of 1.76 million in June, down 6.9% from one year before. The median price in the South was $373,000, up 1.7% from last year. In the West, existing-home sales declined 2.6% in June to an annual rate of 740,000, identical to a year ago. The median price in the West was $629,800, up 3.5% from June 2023. About the National Association of REALTORS® The National Association of REALTORS® is America's largest trade association, representing 1.5 million members involved in all aspects of the residential and commercial real estate industries. The term REALTOR® is a registered collective membership mark that identifies a real estate professional who is a member of the National Association of REALTORS® and subscribes to its strict Code of Ethics. # # # For local information, please contact the local association of REALTORS® for data from local multiple listing services (MLS). Local MLS data is the most accurate source of sales and price information in specific areas, although there may be differences in reporting methodology. NOTE: NAR's Pending Home Sales Index for June is scheduled for release on July 31, and Existing-Home Sales for July will be released on August 22. Release times are 10 a.m. Eastern. 1 Existing-home sales, which include single-family, townhomes, condominiums and co-ops, are based on transaction closings from Multiple Listing Services. Changes in sales trends outside of MLSs are not captured in the monthly series. NAR benchmarks home sales periodically using other sources to assess overall home sales trends, including sales not reported by MLSs. Existing-home sales, based on closings, differ from the U.S. Census Bureau's series on new single-family home sales, which are based on contracts or the acceptance of a deposit. Because of these differences, it is not uncommon for each series to move in different directions in the same month. In addition, existing-home sales, which account for more than 90% of total home sales, are based on a much larger data sample – about 40% of multiple listing service data each month – and typically are not subject to large prior-month revisions. The annual rate for a particular month represents what the total number of actual sales for a year would be if the relative pace for that month were maintained for 12 consecutive months. Seasonally adjusted annual rates are used in reporting monthly data to factor out seasonal variations in resale activity. For example, home sales volume is normally higher in the summer than in the winter, primarily because of differences in the weather and family buying patterns. However, seasonal factors cannot compensate for abnormal weather patterns. Single-family data collection began monthly in 1968, while condo data collection began quarterly in 1981; the series were combined in 1999 when monthly collection of condo data began. Prior to this period, single-family homes accounted for more than nine out of 10 purchases. Historic comparisons for total home sales prior to 1999 are based on monthly single-family sales, combined with the corresponding quarterly sales rate for condos. 2 Total inventory and month's supply data are available back through 1999, while single-family inventory and month's supply are available back to 1982 (prior to 1999, single-family sales accounted for more than 90% of transactions and condos were measured only on a quarterly basis). 3 The median price is where half sold for more and half sold for less; medians are more typical of market conditions than average prices, which are skewed higher by a relatively small share of upper-end transactions. The only valid comparisons for median prices are with the same period a year earlier due to seasonality in buying patterns. Month-to-month comparisons do not compensate for seasonal changes, especially for the timing of family buying patterns. Changes in the composition of sales can distort median price data. Year-ago median and mean prices sometimes are revised in an automated process if additional data is received. The national median condo/co-op price often is higher than the median single-family home price because condos are concentrated in higher-cost housing markets. However, in a given area, single-family homes typically sell for more than condos as seen in NAR's quarterly metro area price reports. 4 Survey results represent owner-occupants and differ from separately reported monthly findings from NAR's REALTORS® Confidence Index, which include all types of buyers. The annual study only represents primary residence purchases, and does not include investor and vacation home buyers. Results include both new and existing homes. 5 Distressed sales (foreclosures and short sales), days on market, first-time buyers, all-cash transactions and investors are from a monthly survey for the NAR's REALTORS® Confidence Index, posted at nar.realtor.
Read MoreNAR Real Estate Forecast Summit: Residential Update, July 2024
" data-src="https://cdn.nar.realtor/sites/default/files/styles/wysiwyg_small2/public/nar-real-estate-forecast-summit-jessica-lautz-presentation-slides-cover-07-22-2024-1300w-867h.png?itok=fZAnTo6G" class="b-lazy" width="200" height="133" alt="Cover of Jessica Lautz's presentation slides: NAR Real Estate Forecast Summit, July 2024" title="Cover of Jessica Lautz's presentation slides: NAR Real Estate Forecast Summit, July 2024"> Download (PDF: 8.71 MB) Presented by NAR Deputy Chief Economist Jessica Lautz at the NAR Real Estate Forecast Summit: Residential Update on July 22, 2024.
Read MoreReal Estate and Economic Outlook July 2024
" data-src="https://cdn.nar.realtor/sites/default/files/styles/wysiwyg_small2/public/real-estate-and-economic-outlook-midyear-nar-forecast-summit-lawrence-yun-presentation-slides-cover-07-22-2024-1300w-867h.png?itok=iPBJVkx2" class="b-lazy" width="200" height="133" alt="Cover of Lawrence Yun's presentation slides: Real Estate and Economic Outlook Midyear NAR Forecast Summit July 2024" title="Cover of Lawrence Yun's presentation slides: Real Estate and Economic Outlook Midyear NAR Forecast Summit July 2024"> Download (PDF: 913 KB) Presented by NAR Chief Economist Lawrence Yun at the NAR Real Estate Forecast Summit: Residential Update on July 22, 2024.
Read MoreInstant Reaction, Mortgage Rates, July 18, 2024
Facts: The 30-year fixed mortgage rate from Freddie Mac fell further to 6.77% over the last week from 6.89%. At 6.77%, with 20% down, a monthly mortgage payment on a home of $400,000 is $2,080; with 10% down, it is $2,340. Positive: This is the lowest mortgage rate reported since March 14. This is the biggest weekly drop in basis points since May. This helps home buyers with one part of the housing affordability equation. Negative: Lower rates are good news for first-time buyers, but may not be enough to move potential sellers who love their low rates. While mortgage applications are up, is it enough to get the housing market out of second gear?
Read MoreTransacciones internacionales con bienes raíces residenciales en EE. UU.
" data-src="https://cdn.nar.realtor/sites/default/files/styles/wysiwyg_small2/public/2024-international-transactions-in-us-residential-real-estate-report-spanish-language-version-cover-07-17-2024-300w-375h.png?itok=vrw96aXt" class="b-lazy" width="200" height="250" alt="Portada de las Transacciones internacionales con bienes raíces residenciales en EE.UU. UU. informe" title="Portada de las Transacciones internacionales con bienes raíces residenciales en EE.UU. UU. informe"> Descargar PDF Al ser la mayor economía del mundo y tierra de inmigrantes, Estados Unidos atrae a personas de todo el mundo que desean vivir, trabajar y estudiar en nuestro país. Los clientes internacionales son un importante nicho de mercado al que los agentes REALTORS® prestan sus servicios. Desde 2009, la National Association of REALTORS® (NAR) realiza una encuesta anual entre sus miembros para medir el volumen de transacciones con bienes raíces residenciales estadounidenses que realizan los clientes internacionales, así como para recabar información sobre el origen, los destinos y las preferencias de compra de estos clientes e identificar los retos y las oportunidades que se les presentan a los REALTORS® al atender a clientes extranjeros. Este Perfil 2024 de transacciones internacionales con bienes raíces residenciales en EE. UU. presenta información relativa a las transacciones de los agentes REALTORS® con clientes internacionales que compraron y vendieron propiedades residenciales en EE. UU. durante el período de 12 meses comprendido entre abril de 2023 y marzo de 2024. TEste informe se basa en una encuesta en línea que se realizó del 4 de abril al 19 de mayo de 2024. La encuesta se envió a 150,000 REALTORS® seleccionados al azar y a miembros de asociaciones estatales y locales, que también realizaron encuestas a compradores extranjeros.1 Para corregir el exceso o defecto de muestreo a nivel estatal, NAR ponderó la distribución de las respuestas respecto de la distribución de sus miembros por estado a mayo de 2024. Un total de 17,060 REALTORS® respondieron la encuesta sobre el mercado nacional, de los cuales 1,407 informaron un comprador extranjero residencial internacional. La información sobre las características de los clientes internacionales se basa en las transacciones cerradas más recientes de los encuestados durante el período de 12 meses. El término cliente internacional o extranjero se refiere a dos tipos de clientes: Extranjeros no residentes (Tipo A): Ciudadanos no estadounidenses con residencia permanente fuera de EE. UU. Extranjeros residentes (Tipo B): Ciudadanos no estadounidenses que son inmigrantes recientes (menos de dos años en el momento de la transacción) o titulares de una visa de no inmigrante que residen por más de seis meses en EE. UU. por motivos profesionales, educativos o de otro tipo. Cabe destacar que, en este informe, la cantidad de compradores extranjeros y la cantidad de propiedades adquiridas se utilizan indistintamente; es decir, se presupone que cada comprador extranjero adquirió una propiedad. Resultados clave $42 mil millones – Volumen en dólares de las compras residenciales realizadas por compradores extranjeros entre abril de 2023 y marzo de 2024 (2.0 % de 2.1 billones de dólares del volumen en dólares de ventas de viviendas existentes). 54,300 – Cantidad de viviendas existentes adquiridas por compradores extranjeros entre abril de 2023 y marzo de 2024 (1.3 % de 4.06 millones de ventas de viviendas existentes). 57% – Compradores extranjeros residentes en Estados Unidos (inmigrantes recientes; menos de dos años en el momento de la transacción) o titulares de una visa de no inmigrante (Tipo B). $475,000 – Precio medio de compra del comprador extranjero (en comparación con $392,600 para todas las viviendas existentes vendidas en EE. UU.). 50% – Compradores extranjeros que pagaron al contado (frente al 28 % de todos los compradores de viviendas existentes). 45% – Compradores extranjeros que adquirieron una propiedad para utilizarla como vivienda de vacaciones, de alquiler o ambas cosas (frente al 16 % del total de compradores de viviendas existentes). 76% – Compradores extranjeros que adquirieron una vivienda unifamiliar independiente o estilo townhouse (frente al 90 % del total de compradores de viviendas existentes). 45% – Compradores extranjeros que compraron en una zona suburbana (similar al 47 % del total de compradores de viviendas existentes). " data-src="https://cdn.nar.realtor/sites/default/files/styles/inline_paragraph_image/public/cantidad-de-vivendas-existentes-adquiridas-por-compradores-extranjeros-miles-de-unidades-2014-a-2024-grafico-de-barras-apiladas-07-17-2024-1300w-675h.png?itok=DlvXD0cd" class="b-lazy" width="1200" height="623" alt="Grafico de barras apiladas: Cantidad de vivendas existentes adquiridas por compradores extranjeros miles de unidades 2014 a 2024" title="Grafico de barras apiladas: Cantidad de vivendas existentes adquiridas por compradores extranjeros miles de unidades 2014 a 2024"> Principales compradores extranjeros Canada (13% de compradores extranjeros, $5.9 mil millones) China (11% de compradores extranjeros, $7.5 mil millones) Mexico (11% de compradores extranjeros, $2.8 mil millones) India (10% de compradores extranjeros, $4.1 mil millones) Colombia (4% de compradores extranjeros, $0.7 mil millones) " data-src="https://cdn.nar.realtor/sites/default/files/styles/inline_paragraph_image/public/porcentaje-de-los-10-principales-paises-de-origen-de-compradores-extranjeros-tabla-07-17-2024-1300w-857h.png?itok=FWgPZGrX" class="b-lazy" width="1200" height="791" alt="Tabla: Porcentaje de los 10 principales paises de origen de compradores extranjeros" title="Tabla: Porcentaje de los 10 principales paises de origen de compradores extranjeros"> Principales destinos Florida (20% de compradores extranjeros) Texas (13%) California (11%) Arizona (5%) Georgia (4%) " data-src="https://cdn.nar.realtor/sites/default/files/styles/inline_paragraph_image/public/porcentaje-de-los-10-principales-estados-en-el-total-de-compras-de-compradores-extranjeros-tabla-07-17-2024-1278w-826h.png?itok=bUdkTIt2" class="b-lazy" width="1200" height="776" alt="Tabla: Porcentaje de los 10 principales estados en el total de compras de compradores extranjeros" title="Tabla: Porcentaje de los 10 principales estados en el total de compras de compradores extranjeros"> Descargue el informe completo Lea el comunicado de prensa 1 A la muestra aleatoria nacional, se añadieron las respuestas de las encuestas de Canopy Association of REALTORS®, Central Carolina Association of REALTORS®, Chicago Mainstreet Organization of REALTORS®, Greater Metropolitan Association of REALTORS®, Houston Association of REALTORS®, Long Island Board of REALTORS®, Piedmont Regional Association of REALTORS®, California Association of REALTORS®, Ohio REALTORS® y Texas REALTORS®. El conjunto total de respuestas se ponderó según la distribución por estados de los miembros de NAR con especialización principal en bienes raíces residenciales.
Read MoreInstant Reaction Housing Starts, July 17, 2024
New apartment units completed reached a 50-year high in June. That is truly a wow. The rents have stopped rising in many cities due to the oversupply of rental units. Rents whether on apartments or on single-family rentals have fallen in Austin, Nashville, Charlotte, and Phoenix where the supply has been even more overwhelming. This indicates that rent controls are not needed, but just more supply to address housing affordability. But the concern is that new multifamily housing starts year-to-date are around 10-year lows. The high financing costs and low current rent growth have reduced the incentive to build. The current supply is due to active construction starts of the past. It takes around two years to finish apartment construction. Perhaps, there will be a rental housing shortage in a couple of years. Single-family housing completion was above 1 million, which is decent, though more would help. But single-family housing starts were below one million in the latest month. The Fed policy of high interest rates, counterintuitively, could raise inflation in future years. Lower interest rates soon will lead to more housing supply and lower future housing inflation. " data-src="https://cdn.nar.realtor/sites/default/files/styles/inline_paragraph_image/public/multifamily-completion-and-multifamily-starts-january-2020-to-june-2024-line-graph-07-17-2024-1280w-720h.jpg?itok=4S5M6EKE" class="b-lazy" width="1200" height="675" alt="Line graph: Multifamily Completion and Multifamily Starts, January 2020 to June 2024" title="Line graph: Multifamily Completion and Multifamily Starts, January 2020 to June 2024"> " data-src="https://cdn.nar.realtor/sites/default/files/styles/inline_paragraph_image/public/rental-housing-vacancy-rates-q1-2020-to-q1-2024-line-graph-07-17-2024-1280w-720h.jpg?itok=eqdr1jox" class="b-lazy" width="1200" height="675" alt="Line graph: Rental Housing Vacancy Rates, Q1 2020 to Q1 2024" title="Line graph: Rental Housing Vacancy Rates, Q1 2020 to Q1 2024"> " data-src="https://cdn.nar.realtor/sites/default/files/styles/inline_paragraph_image/public/rents-in-private-sector-data-q1-2022-to-q2-2024-line-graph-07-17-2024-1280w-720h.jpg?itok=CkGT4EsO" class="b-lazy" width="1200" height="675" alt="Line graph: Rents in Private Sector Data, Q1 2022 to Q2 2024" title="Line graph: Rents in Private Sector Data, Q1 2022 to Q2 2024"> " data-src="https://cdn.nar.realtor/sites/default/files/styles/inline_paragraph_image/public/rents-in-consumer-price-index-official-government-data-q1-2022-to-q2-2024-line-graph-07-17-2024-1280w-720h.jpg?itok=dpDKGlc-" class="b-lazy" width="1200" height="675" alt="Line graph: Rents in Consumer Price Index Official Government Data, Q1 2022 to Q2 2024" title="Line graph: Rents in Consumer Price Index Official Government Data, Q1 2022 to Q2 2024"> " data-src="https://cdn.nar.realtor/sites/default/files/styles/inline_paragraph_image/public/single-family-completion-and-single-family-housing-starts-january-2020-to-june-2024-line-graph-07-17-2024-1280w-720h.jpg?itok=jnJGQJLm" class="b-lazy" width="1200" height="675" alt="Line graph: Single-family Completion and Single-family Housing Starts, January 2020 to June 2024" title="Line graph: Single-family Completion and Single-family Housing Starts, January 2020 to June 2024"> " data-src="https://cdn.nar.realtor/sites/default/files/styles/inline_paragraph_image/public/inventory-of-existing-homes-and-inventory-of-newly-constructed-homes-january-2011-to-january-2024-line-graph-07-17-2024-1280w-720h.jpg?itok=07sDwyze" class="b-lazy" width="1200" height="675" alt="Line graph: Inventory of Existing Homes and Inventory of Newly Constructed Homes, January 2011 to January 2024" title="Line graph: Inventory of Existing Homes and Inventory of Newly Constructed Homes, January 2011 to January 2024">
Read MoreAnnual Foreign Investment in U.S. Existing Homes Sales Decreased 21.2% to $42 Billion

Key Highlights International buyers purchased $42 billion worth of U.S. residential properties from April 2023 to March 2024, down 21.2% from the prior year. The 54,300 existing homes sold – the lowest since NAR began tracking in 2009 – slid 36% from the previous year. The average ($780,300) and median ($475,000) purchase prices for foreign buyers were the highest ever recorded by NAR. Canada, China, Mexico and India were the top countries of origin by number of U.S. existing homes purchased. The top U.S. destinations for foreign buyers were Florida (20%), Texas (13%), California (11%), Arizona (5%), Georgia, New Jersey, New York and North Carolina (4% each). WASHINGTON (July 17, 2024) – Foreign buyers purchased $42 billion worth of U.S. existing homes from April 2023 through March 2024, retreating 21.2% from the prior 12-month period, according to a new report from the National Association of Realtors®. International buyers purchased 54,300 properties, down 36% from the previous year and the fewest number of homes bought since 2009 when NAR began tracking this data. Overall, U.S. existing-home sales totaled 4.09 million in 2023, down 18.7% from 2022, and the lowest level since 1995. "The strong U.S. dollar makes international travel cheaper for Americans but makes U.S. homes much more expensive for foreigners," said NAR Chief Economist Lawrence Yun. "Therefore, it's not surprising to see a pullback in U.S. home sales from foreign buyers." NAR's 2024 International Transactions in U.S. Residential Real Estate report surveyed members about transactions with international clients who purchased and sold U.S. residential property from April 2023 through March 2024. Foreign buyers who resided in the U.S. as recent immigrants or who were holding visas that allowed them to live in the U.S. purchased $22.6 billion worth of U.S. existing homes, a 3.4% decline from the previous year and representing 54% of the dollar volume of purchases. Foreign buyers who lived abroad purchased $19.4 billion worth of existing homes, down 35% from the 12 months prior and accounting for 46% of the dollar volume. International buyers accounted for 2% of the $2.1 trillion in total U.S. existing-home sales during that period. "Historically low housing inventory and escalating prices remain significant factors in constraining home sales for American and international buyers alike," Yun added. The average ($780,300) and median ($475,000) existing-home sales prices among international buyers were the highest ever recorded by NAR – and 21.9% and 19.8% higher, respectively, than the prior year. The increase in prices for foreign buyers reflected the overall price increase for all U.S. existing homes, which climbed to $392,600. At $1.3 million, Chinese buyers had the highest average purchase price, with 25% purchasing property in California. In total, 18% of international buyers purchased properties worth more than $1 million from April 2023 to March 2024. Canada led all countries of origin in the share of foreign buyer purchases of U.S. existing homes at 13%, followed by China and Mexico (11% each), and India (10%). China was first in U.S. residential sales dollar volume at $7.5 billion, continuing a trend going back to 2013. Canada ($5.9 billion), India ($4.1 billion), Mexico ($2.8 billion) and Colombia ($0.7 billion) rounded out the top five. For the 16th consecutive year, Florida remained the top destination for foreign buyers, accounting for 20% of all international purchases. Texas (13%) and California (11%) were second and third, respectively, followed by Arizona (5%), Georgia, New Jersey, New York and North Carolina (4% each). All-cash sales accounted for half of international buyer transactions compared to 28% of all existing-home buyers. Non-resident foreign buyers (68%) were more likely to make an all-cash purchase than resident foreign buyers (36%). More than two-thirds of Canadian (69%) and Chinese (68%) buyers made all-cash purchases, the highest shares among the top foreign buyer nations. "Fostering economic investment in culturally dynamic communities, businesses, and industries is a top priority for NAR," said Alex Escudero, NAR's director of global strategy. "Our work provides members and their communities with tools, resources and data to identify and highlight international investment opportunities in U.S. real estate. This supports local communities to drive economic development in markets across the country. NAR and the Realtor® brand have developed a network of more than 8,000 international Realtor® members outside of the USA and expanded our global footprint to more than 100 real estate organizations across 78 countries, providing growth opportunities by ensuring ethical and accessible markets that allow our members to make direct connections with global-minded real estate professionals and international investors." NAR will host its "Unlocking Global Opportunities" webinar on Wednesday, July 31, at 1 p.m. Eastern, where experts will discuss the findings of this year's report, and Realtors® will share their personal experiences with international investment and how it has expanded their business. The webinar is open to the public and interested parties can register here. View the full 2024 International Transactions in U.S. Residential Real Estate report at: nar.realtor/research-and-statistics/research-reports/international-transactions-in-u-s-residential-real-estate. The National Association of Realtors® is America's largest trade association, representing 1.5 million members involved in all aspects of the residential and commercial real estate industries. The term Realtor® is a registered collective membership mark that identifies a real estate professional who is a member of the National Association of Realtors® and subscribes to its strict Code of Ethics. # # #
Read MoreInstant Reaction: Mortgage Rates, July 11, 2024
Facts: The 30-year fixed mortgage rate from Freddie Mac declined to 6.89% over the last week from 6.95%. At 6.89%, with 20% down, a monthly mortgage payment on a home of $400,000 is $2,105; with 10% down, it is $2,369. Positive: The CPI retreated today. Importantly, shelter, which is a lagging component but more than one-third of CPI, had slower gains. Fed Chair Jerome Powell indicated to Congress yesterday that there is a path to lowering the Fed Funds rate if inflation continues to cool. Today’s reading showed a measure of cooling. Negative: Yesterday, Powell indicated “we probably won’t go back” to the ultralow rates seen in the last 10-15 years. For those thinking of mortgage interest rates—the implication has a ripple effect—buyers waiting for mortgage rates to again be at once-in-a-lifetime lows are likely going to be waiting a very long time.
Read More
Categories
Recent Posts