Homes And Hurdles: Analyzing The Journey of Single Female Home Buyers
Earlier this year, for Women’s History Month, we published a blog post about the triumphs and challenges of female homeownership. We celebrated single women's impressive progress in the housing market but also pointed out the ongoing obstacles, especially for women of color. These women often deal with systemic barriers rooted in past and present racial discrimination, like limited access to quality education, job opportunities, and affordable housing. Additionally, income and wealth disparities—both generational and personal—can make it harder to become homeowners. While there has been progress, the journey isn't over yet. In this blog post, we'll look closer at who is buying homes, the sociodemographic factors that influence home buying, and the ages at which single female home buyers enter the market. For a quick recap: Since 1981, the inaugural year of the National Association of REALTORS® Profile of Home Buyers and Sellers report, single women have outpaced nearly all other household composition groups, ranking just behind married couples. " data-src="https://cdn.nar.realtor/sites/default/files/styles/inline_paragraph_image/public/economists-outlook-household-composition-home-buyers-1981-to-2023-line-graph-07-10-2024-1280w-720h.png?itok=r1naKJvy" class="b-lazy" width="1200" height="675" alt="Line graph: Household Composition of Homebuyers 1981 to 2023" title="Line graph: Household Composition of Homebuyers 1981 to 2023"> In 2007, we began reporting on the racial and ethnic composition of home buyers by household type in our Home Buyers and Sellers report. While single women are purchasing homes at the second highest rate compared to other household compositions, women of color remain significantly underserved in the housing market. When examining an average of the past 16 years, White women have dominated the category of single female home buyers, making up 82% of this group. By contrast, women of color are represented in much smaller percentages: Hispanic/Latina women at 6%, Black/African American women at 8%, and Asian/Pacific Islander women at just 3%. This disparity highlights the ongoing need to address the unique challenges women of color face in achieving homeownership. " data-src="https://cdn.nar.realtor/sites/default/files/styles/inline_paragraph_image/public/economists-outlook-racial-composition-single-female-homebuyers-2007-to-2023-line-graph-07-10-2024-1280w-720h.png?itok=WlbQE0UA" class="b-lazy" width="1200" height="675" alt="Line graph: Racial Composition of Single Female Homebuyers 2007 to 2023" title="Line graph: Racial Composition of Single Female Homebuyers 2007 to 2023"> We saw similar patterns using data from our 2023 home Buyers and Sellers report. When broken down by generation, White single female home buyers dominated across all generations. In some cases, such as those with the Older Boomers and the Silent Generation, 9 out of 10 single female home buyers were White. Younger Millennials (those born from 1990 to 1998) saw the most diversity in single-female home buying, with 32% being women of color. " data-src="https://cdn.nar.realtor/sites/default/files/styles/inline_paragraph_image/public/economists-outlook-percentage-women-of-color-single-female-homebuyer-silent-generation-to-gen-z-infographic-07-10-2024-720w-1280h.png?itok=Ni1ZJx0S" class="b-lazy" width="720" height="1280" alt="Infographic: Percentage of Women of Color Single Female Homebuyer Silent Generation to Gen Z" title="Infographic: Percentage of Women of Color Single Female Homebuyer Silent Generation to Gen Z"> Over the past 60 years, homeownership rates among college graduates in the United States have risen by ten percentage points. Drawing from our Profile of Home Buyers and Sellers report, we can explore the educational levels of single female home buyers across various racial and ethnic groups. Notably, single female home buyers are more likely to be college-educated than not. A striking 95% of Asian/Pacific Islander single female home buyers hold college degrees, followed by Hispanic/Latina home buyers at 83%, White single female home buyers at 81%, and Black/African American female home buyers at 77%. The data also highlights the diversity in educational backgrounds among these home buyers, indicating that while higher education is a common thread, women with varying educational attainments actively participate in the housing market. For instance, 22% of Black/African American single female home buyers have a high school diploma, the highest proportion among all racial/ethnic groups. Additionally, Asian/Pacific Islander and Hispanic/Latina single female home buyers are more likely to have completed some graduate school, at 49% and 32%, respectively. This diversity underscores the multifaceted nature of educational attainment among single female home buyers. " data-src="https://cdn.nar.realtor/sites/default/files/styles/inline_paragraph_image/public/economists-outlook-educational-attainment-single-female-homebuyers-bar-graph-07-10-2024-1280w-720h.png?itok=FFNcWdgx" class="b-lazy" width="1200" height="675" alt="Educational Attainment of Single Female Homebuyers" title="Educational Attainment of Single Female Homebuyers"> When analyzing single female home buyers across racial and ethnic groups, Asian/Pacific Islander, Black/African American, and White female home buyers are more likely to be in the highest income bracket ($85,000 and above). Asian/Pacific Islander female home buyers lead this category with a significant presence at 56%, followed by Black/African American women at 45%. Hispanic/Latina women and women of other racial/ethnic identities are less represented in this high-income bracket, at 36% and 31%, respectively. Hispanic/Latina women and women of other racial/ethnic identities are more likely to fall into the moderate-income bracket ($55,000-$84,999), at 39% and 34%. When it comes to the lowest income bracket (less than $25,000), women of other racial/ethnic identities have the highest representation at 17%, significantly higher than any other group. This data reveals an apparent economic disparity among single female home buyers across different racial and ethnic groups. White women are more evenly distributed across all income levels, whereas Hispanic/Latina, Black/African American, and Asian/Pacific Islander women are more concentrated in the highest two income brackets. " data-src="https://cdn.nar.realtor/sites/default/files/styles/inline_paragraph_image/public/economists-outlook-income-single-female-homebuyers-2022-07-10-2024-1280w-720h.png?itok=8_ubN52E" class="b-lazy" width="1200" height="675" alt="Bar graph: Income of Single Female Homebuyers in 2022" title="Bar graph: Income of Single Female Homebuyers in 2022"> In 2023, the median age of a single female home buyer was 55. Single Black/African American women had the lowest median age at 47, while White women had the highest median age at 65, which is ten years above the overall median. " data-src="https://cdn.nar.realtor/sites/default/files/styles/inline_paragraph_image/public/economists-outlook-median-ages-single-female-homebuyers-by-race-ethnicity-table-07-10-2024-1280w-366h.png?itok=uN14PN1D" class="b-lazy" width="1200" height="343" alt="Table: Median Ages of Single Female Homebuyers by Race/Ethnicity" title="Table: Median Ages of Single Female Homebuyers by Race/Ethnicity"> Seventy-three percent of White single female home buyers were repeat buyers in 2023. Black/African American and Asian/Pacific Islander single female home buyers were more likely to be first-time buyers at 61% and 56%, respectively. " data-src="https://cdn.nar.realtor/sites/default/files/styles/inline_paragraph_image/public/economists-outlook-percent-distribution-single-female-homebuyers-by-race-ethnicity-and-first-time-repeat-table-07-10-2024-1280w-366h.png?itok=_87m9Aae" class="b-lazy" width="1200" height="343" alt="Table: Percent Distribution of Single Female Homebuyers by Race/Ethnicity and First-Time Repeat" title="Table: Percent Distribution of Single Female Homebuyers by Race/Ethnicity and First-Time Repeat"> There are more illuminating insights into this landscape when we look at the median ages of single female home buyers segmented by race/ethnicity and whether they are first-time or repeat buyers. For first-time buyers, the median age varies across different groups. Asian/Pacific Islander women are the youngest first-time buyers at a median age of 31, while Black/African American women are the oldest at 43. White and Hispanic/Latina women fall in between, with median ages of 37 and 35, respectively. When it comes to repeat buyers, the age differences remain notable. Asian/Pacific Islander women continue to be the youngest, with a median age of 41. Hispanic/Latina and Black/African American women are slightly older, with median ages of 57 and 59, respectively. Whites have a wider age range, with a median age of 62. Asian/Pacific Islander women tend to enter the housing market earlier than their counterparts from other racial/ethnic groups, both as first-time and repeat buyers. On the other hand, Black/African American women tend to be older when they purchase their first home compared to other groups. This may suggest socioeconomic factors influencing the timing of home purchases among different racial/ethnic groups. " data-src="https://cdn.nar.realtor/sites/default/files/styles/inline_paragraph_image/public/economists-outlook-median-ages-single-female-homebuyers-by-race-ethnicity-first-time-repeat-buyer-table-07-10-2024-1280w-366h.png?itok=P6H7PCGN" class="b-lazy" width="1200" height="343" alt="Table: Median Ages of Single Female Homebuyers by Race/Ethnicity and First-Time/Repeat Buyer" title="Table: Median Ages of Single Female Homebuyers by Race/Ethnicity and First-Time/Repeat Buyer">
Read More-
Key Highlights Brokerage specialists had a lower sales volume ($2.5 million vs. $3.4 million), and the typical agent had fewer transactions (10 vs. 12) in 2023 compared to 2022. Seventy-three percent of REALTORS® plan to remain in the real estate industry for at least two more years. New members were more diverse than experienced members. Among those who had two years or less of experience, 40% were non-White. WASHINGTON (July 10, 2024) – In 2023, when the volume of existing-home sales hit the lowest level since 1995, 26% of REALTORS® named lack of inventory and housing affordability as the most important factors limiting potential clients from making a purchase, according to the National Association of REALTORS®' 2024 Member Profile. This annual report analyzes members' business activity and demographics from the prior year. “2023 was a difficult year for REALTORS® due to high mortgage rates and low housing inventory, which significantly impacted home sales volume,” said Jessica Lautz, NAR deputy chief economist and vice president of research. “REALTORS® faced competition at all angles – not only to represent clients but also to ensure their buyers’ offers were accepted amid tough real estate market conditions.” Nearly two out of three REALTORS® (65%) hold sales agent licenses, while 22% hold broker licenses and 17% hold broker associate licenses. Seventy-four percent of members specialize in residential brokerage. Like 2022, relocation, residential property management and commercial brokerage are members’ most common secondary specialty areas. Members typically have 10 years of real estate experience, down from 11 years in 2022. Seventy-three percent of members are very certain they will remain in the real estate industry for at least two more years. Brokerage specialists had a lower sales volume ($2.5 million vs. $3.4 million), and the typical agent had fewer transactions (10 vs. 12) in 2023 compared to 2022. The typical REALTOR® earned 20% of their business from previous clients and customers, down from 27% last year. The most experienced members – those with 16 or more years of experience – reported a greater share of repeat business from clients or referrals (a median of 42% in 2023). Similar to 2022, members with two years of experience or less reported no repeat business in 2023. Overall, REALTORS® earned a median of 21% of their business from referrals, a decrease from 24% in 2022. Referrals were also more common among members with 16 or more years of experience – a median of 29% – compared to no referrals for those with two years or less of experience. The typical property manager managed 31 properties in 2023, down notably from 40 properties in 2022. The typical REALTOR® worked 35 hours per week in 2023, slightly less than last year. The median gross income for REALTORS® decreased to $55,800 in 2023, down from $56,400 in 2022. REALTORS® with 16 years or more experience had a median gross income of $92,500, up from $80,700 in 2022. REALTORS®’ total expenses increased to $8,450 in 2023 from $8,210 in 2022. A majority of REALTORS® (53%) worked with an independent company and 88% were independent contractors at their firms – both figures nearly identical to 2022. The typical REALTOR® had a median tenure of five years with their current firm, down from a median of six years in 2022. Eight percent of members reported working for a firm that was bought or merged in the past two years, down from 26% in 2022. “Regardless of market conditions, agents who are REALTORS® sought a career where they could be their own boss as an independent contractor, specialize in residential or commercial brokerage, and embrace new technologies to make transactions happen,” said Lautz. Daily, most REALTORS® use a smartphone with wireless email and internet capability (96%) and a laptop or desktop computer (91%). The smartphone features that members use most frequently daily are email (94%), social media apps (60%) and GPS (56%). Sixty-four percent of REALTORS® use multiple listings software daily. Text messaging (94%) is the top method of communication for members with their clients, followed by telephone (91%) and email (89%). More than two-thirds of members (72%) have their own website – 44% of which are provided by the member’s firm. For professional purposes, most members use Facebook (77%), Instagram (57%), and LinkedIn (55%). Six percent of REALTORS® use drones themselves as part of their business, and 46% have hired a professional drone operator. Four percent and 2% of members, respectively, use 3D/virtual tour and virtual staging technology daily. Sixty-five percent of all REALTORS® were female in 2023, an increase from 62% last year. The median age of REALTORS® was 55, down from 60 last year. Thirty-five percent were 60 years or older and 4% were less than 30. Seventy-nine percent of REALTORS® were White in 2023, down from 81% last year. Hispanics/Latinos accounted for 10% of REALTORS®, followed by Black/African Americans (6%) and Asian/Pacific Islanders (4%). New members were more diverse than experienced members. Among those who had two years or less of experience, 40% were non-White. REALTORS ®’ education level exceeded that of the general public. Ninety-two percent of members had some post-secondary education, with 34% completing a bachelor’s degree as their highest level of education. Seventy percent of members reported volunteering in their community – most commonly among members aged 40 to 49 years. “REALTORS® are hardworking people who advocate for homeownership and property rights in the communities they serve,” said NAR President Kevin Sears, broker-partner of Sears Real Estate/Lamacchia Realty in Springfield, Massachusetts. “Regardless of how you find a property, expert agents who are REALTORS® help take the stress out of the homebuying process and navigate the most intricate and significant transaction many will ever complete.” Survey Methodology In March 2024, NAR emailed a 98-question survey to a random sample of 157,711 REALTORS® and received 6,113 responses. The survey had an adjusted response rate of 3.9%. The confidence interval at a 95% level of confidence is +/- 1.25% based on a population of 1.5 million members. The association weighted responses to be representative of state-level NAR membership. Information about compensation, earnings, sales volume and number of transactions are characteristics of calendar year 2023, while all other data are representative of member characteristics in early 2024. For more information from NAR’s 2024 Member Profile, visit https://www.nar.realtor/research-and-statistics/research-reports/highlights-from-the-nar-member-profile. About the National Association of REALTORS® The National Association of REALTORS® is America's largest trade association, representing more than 1.5 million members involved in all aspects of the residential and commercial real estate industries. The term REALTOR® is a registered collective membership mark that identifies a real estate professional who is a member of the National Association of REALTORS® and subscribes to its strict Code of Ethics. # # #
Read More Instant Reaction: Mortgage Rates, July 03, 2024
Facts: The 30-year fixed mortgage rate from Freddie Mac increased to 6.95% over the last week from 6.86%. This is the first weekly increase since May 30. At 6.95%, with 20% down, a monthly mortgage payment on a home of $400,000 is $2,118. Positive: While mortgage rates increased this week and affordability is bleak, there is also slightly more existing inventory coming onto the market. Home buyers at higher incomes may stand a chance to have their offer accepted as moderate-income buyers are forced to the sidelines—this is especially true of first-time buyers who have been largely shut out of the market. Negative: The lock-in impact of higher rates for a prolonged period means someone who purchased or refinanced a $400,000 home at 3% vs. 6.95% would have a monthly mortgage payment of $1,349, a difference of $769 a month. This is unfathomable for many Americans, even with life changes.
Read MoreJune 2024 Commercial Real Estate Market Insights
" data-src="https://cdn.nar.realtor/sites/default/files/styles/wysiwyg_small2/public/2024-06-commercial-real-estate-market-insights-report-cover-07-02-2024-300w-434h.png?itok=l7MvEWzP" class="b-lazy" width="200" height="289" alt="Cover of the June 2024 Commercial Real Estate Market Insights report" title="Cover of the June 2024 Commercial Real Estate Market Insights report"> Download PDF The Commercial real estate (CRE) market continued to experience the same trends in May: office vacancy rates remained at a record high of nearly 14%, fundamentals for both retail and industrial sectors weakened, and demand for apartment buildings grew further due to low affordability. However, there are signs that demand for office space has likely already seen the bottom. Office Sector Net absorption for the office sector remains negative, with more vacant spaces than occupied. However, data indicates that the gap between vacated and occupied spaces is narrowing. As of May 2024, nearly 49 million square feet of office space were vacated more than leased, down from 57 million square feet in the first quarter and 59 million square feet at the end of the previous year. Although there may be a slight increase in demand for office space in 2024, the outlook suggests that net absorption for this sector will remain in negative territory. Leasing activity, an indicator of demand and interest from potential tenants, is currently near pandemic levels and about 40 percentage points below pre-pandemic levels. " data-src="https://cdn.nar.realtor/sites/default/files/styles/inline_paragraph_image/public/12-month-net-office-absorption-in-square-feet-q1-2021-to-q2-2024-bar-graph-07-02-2024-548w-529h.png?itok=QcoIJiT-" class="b-lazy" width="548" height="529" alt="Bar graph: 12-Month Net Office Absorption in Square Feet, Q1 2021 to Q2 2024" title="Bar graph: 12-Month Net Office Absorption in Square Feet, Q1 2021 to Q2 2024"> Multifamily Sector Conversely, the multifamily sector continues to gain momentum with mortgage rates remaining near 7%. Net absorption is 2.5 times higher than a year ago, with an additional 265,000 more multifamily units leased than vacated. Even though a rising number of multifamily units are delivered in the market, the vacancy rate slightly eased in May to 7.7% due to this strong demand. In fact, the multifamily vacancy rate declined for the first time since Q3 2021. " data-src="https://cdn.nar.realtor/sites/default/files/styles/inline_paragraph_image/public/top-10-areas-with-fastest-rent-growth-q2-2024-and-q2-2023-table-07-02-2024-489w-569h.png?itok=u4JdmVLP" class="b-lazy" width="489" height="569" alt="Table: Top 10 Areas With Fastest Rent Growth, Q2 2024 and Q2 2023" title="Table: Top 10 Areas With Fastest Rent Growth, Q2 2024 and Q2 2023"> Retail Sector The retail sector continues to have the tightest availability conditions in the commercial real estate market. Only 4.7% of retail space is currently available for lease, the lowest level on record. Due to limited availability, the vacancy rate is still near 4%, even though net absorption has slowed down further in May. Specifically, in the last 12 months, demand for retail spaces has increased by nearly 39 million square feet compared to 57 million square feet a year earlier. With new construction deliveries diminishing further, the fundamentals of this sector are expected to remain tight in 2024. " data-src="https://cdn.nar.realtor/sites/default/files/styles/inline_paragraph_image/public/12-month-net-retail-absorption-by-type-q1-2014-to-q2-2024-line-graph-07-02-2024-624w-248h.png?itok=oY9RdNMu" class="b-lazy" width="624" height="248" alt="Line graph: 12-Month Net Retail Absorption by Type, Q1 2014 to Q2 2024" title="Line graph: 12-Month Net Retail Absorption by Type, Q1 2014 to Q2 2024"> Industrial Sector Fundamentals for the industrial sector have further weakened in May. Net absorption has fallen to levels not seen in over a decade. After reaching record-high levels at the end of 2021 and the beginning of 2022, driven by the demand for warehouse space to support online shopping and e-commerce, net absorption is currently 68% lower than a year ago and 60% below the pre-pandemic average level. The outlook suggests further softening in this sector. High borrowing costs have shifted consumer spending away from goods towards services, which can impact the demand for industrial spaces in the coming months. " data-src="https://cdn.nar.realtor/sites/default/files/styles/inline_paragraph_image/public/top-10-areas-with-the-strongest-industrial-absorption-q2-2024-and-q2-2023-table-07-02-2024-473w-553h.png?itok=IC-8jB0D" class="b-lazy" width="473" height="553" alt="Table: Top 10 Areas With the Strongest 12-Month Industrial Absorption, Q2 2024 and Q2 2023" title="Table: Top 10 Areas With the Strongest 12-Month Industrial Absorption, Q2 2024 and Q2 2023"> Hotel Sector As 2024 continues, the hospitality sector is seeing improvements. Hotel occupancy rates have leveled off at around 63%, remaining roughly 3% below pre-pandemic figures, which suggests that a complete recovery may be elusive due to the prevalence of remote work. Nevertheless, average daily rates and revenue per available room have now exceeded pre-pandemic benchmarks. " data-src="https://cdn.nar.realtor/sites/default/files/styles/inline_paragraph_image/public/12-month-hotel-occupancy-rate-may-2019-2020-2021-2022-2023-2024-bar-graph-06-03-2024-609w-365h.png?itok=1TxJIZ7y" class="b-lazy" width="609" height="365" alt="Bar graph: 12-month Hotel Occupancy Rate, May 2019, 2020, 2021, 2022, 2023, and 2024" title="Bar graph: 12-month Hotel Occupancy Rate, May 2019, 2020, 2021, 2022, 2023, and 2024"> Download the full report
Read MorePending Sales in May 2024 Hit a New Low
NAR released a summary of pending home sales data showing that May’s pending home sales fell 2.1% from last month and decreased 6.6% from a year ago. " data-src="https://cdn.nar.realtor/sites/default/files/styles/inline_paragraph_image/public/economists-outlook-pending-home-sales-may-2023-to-may-2024-bar-graph-07-01-2024-1300w-670h.png?itok=A6bGG5gt" class="b-lazy" width="1200" height="618" alt="Bar graph: Pending Home Sales, May 2023 to May 2024" title="Bar graph: Pending Home Sales, May 2023 to May 2024"> Pending sales represent homes that have a signed contract to purchase on them but have yet to close. They tend to lead existing-home sales data by 1 to 2 months. All four regions showed declines from a year ago. The South region had the biggest decrease of 10.4%, followed by the Midwest with a decline of 5.6%. The Northeast fell 2.3%, followed by the West with a reduction in sales of 2.1%. " data-src="https://cdn.nar.realtor/sites/default/files/styles/inline_paragraph_image/public/economists-outlook-may-us-and-regional-pending-sales-2024-and-2023-bar-graph-07-01-2024-1300w-671h.png?itok=rsheC3N4" class="b-lazy" width="1200" height="619" alt="Bar graph: May U.S. and Regional Pending Sales, 2024 and 2023" title="Bar graph: May U.S. and Regional Pending Sales, 2024 and 2023"> Compared to last month, two of the four regions showed increases in contract signings. The West had the biggest incline of 1.4%, followed by the Northeast with an increase of 1.1%. The South had the biggest decline of 5.5%, and the Midwest had a drop in contracts of 0.4%. The U.S. pending home sales index level for the month of May was 70.8. April’s pending sales figures were 72.3. May’s contract signings brought the pending home sales index below the 100-level mark for the 26th consecutive month. The 100 level, based on a 2001 benchmark, serves as a crucial reference point, consistent with existing-home sales above the 5 million mark. " data-src="https://cdn.nar.realtor/sites/default/files/styles/inline_paragraph_image/public/economists-outlook-us-and-regional-pending-home-sales-index-january-2019-to-may-2024-line-graph-07-01-2024-1300w-719h.png?itok=TuliyolE" class="b-lazy" width="1200" height="664" alt="Line graph: U.S. and Regional Pending Home Sales Index, January 2019 to May 2024 " title="Line graph: U.S. and Regional Pending Home Sales Index, January 2019 to May 2024 ">
Read MorePending Home Sales Dropped 2.1% in May
Key Highlights Pending home sales decreased 2.1% in May. Month over month, contract signings declined in the Midwest and South but increased in the Northeast and West. Compared to one year ago, pending home sales declined in all U.S. regions. " data-src="https://www.nar.realtor/sites/default/files/styles/inline_paragraph_image/public/downloadable/2024-05-pending-home-sales-housing-snapshot-infographic-07-27-2024-1000w-1500h.png?itok=4SPbdPsa" class="b-lazy" width="1000" height="1501" alt="Pending Home Sales Snapshot - May 2024" title="Pending Home Sales Snapshot - May 2024"> See and share this infographic. WASHINGTON (June 27, 2024) – Pending home sales in May slipped 2.1%, according to the National Association of REALTORS®. The Midwest and South posted monthly losses in transactions while the Northeast and West recorded gains. Year-over-year, all U.S. regions registered reductions. The Pending Home Sales Index (PHSI)* – a forward-looking indicator of home sales based on contract signings – decreased to 70.8 in May. Year over year, pending transactions were down 6.6%. An index of 100 is equal to the level of contract activity in 2001. “The market is at an interesting point with rising inventory and lower demand,” said NAR Chief Economist Lawrence Yun. “Supply and demand movements suggest easing home price appreciation in upcoming months. Inevitably, more inventory in a job-creating economy will lead to greater home buying, especially when mortgage rates descend.” U.S. Economic Forecast NAR predicts mortgage rates will remain above 6% in 2024 and 2025, even with the Federal Reserve cuts to the Fed Funds rate. The association forecasts that existing-home sales will rise to 4.26 million in 2024 (from 4.09 million 2023) and to 4.92 million in 2025 (from 2024). Housing starts are expected to rise to 1.382 million in 2024 (from 1.413 million in 2023) and to 1.492 million in 2025 (from 2024). NAR anticipates the median existing-home price will increase to a record annual high of $405,300 in 2024 (from $389,800 in 2023) and to $412,000 in 2025 (from 2024). NAR forecasts increases in the median new home price to $434,100 in 2024 (from $428,600 in 2023) and $441,200 in 2025 (from 2024). “The first half of the year did not meet expectations regarding home sales but exceeded expectations related to home prices,” explained Yun. “In the second half of 2024, look for moderately lower mortgage rates, higher home sales and stabilizing home prices.” Pending Home Sales Regional Breakdown The Northeast PHSI ascended 1.1% from last month to 63.6, a decline of 2.3% from May 2023. The Midwest index dropped 0.4% to 70.4 in May, down 5.6% from one year ago. The South PHSI lowered 5.5% to 83.7 in May, falling 10.4% from the prior year. The West index increased 1.4% in May to 56.7, down 2.1% from May 2023. About the National Association of REALTORS® The National Association of REALTORS® is America's largest trade association, representing 1.5 million members involved in all aspects of the residential and commercial real estate industries. The term REALTOR® is a registered collective membership mark that identifies a real estate professional who is a member of the National Association of REALTORS® and subscribes to its strict Code of Ethics. # # # *The Pending Home Sales Index is a leading indicator for the housing sector, based on pending sales of existing homes. A sale is listed as pending when the contract has been signed but the transaction has not closed, though the sale usually is finalized within one or two months of signing. Pending contracts are good early indicators of upcoming sales closings. However, the amount of time between pending contracts and completed sales is not identical for all home sales. Variations in the length of the process from pending contract to closed sale can be caused by issues such as buyer difficulties with obtaining mortgage financing, home inspection problems, or appraisal issues. The index is based on a sample that covers about 40% of multiple listing service data each month. In developing the model for the index, it was demonstrated that the level of monthly sales-contract activity parallels the level of closed existing-home sales in the following two months. An index of 100 is equal to the average level of contract activity during 2001, which was the first year to be examined. By coincidence, the volume of existing-home sales in 2001 fell within the range of 5.0 to 5.5 million, which is considered normal for the current U.S. population. NOTE: Existing-Home Sales for June will be released July 23. The next Pending Home Sales Index will be released June 31. All release times are 10 a.m. Eastern. View the NAR Statistical News Release Schedule.
Read MoreExisting-Home Sales Edged Lower by 0.7% in May as Median Sales Price Reached Record High of $419,300
Key Highlights Existing-home sales slipped 0.7% in May to a seasonally adjusted annual rate of 4.11 million. Sales descended 2.8% from one year ago. The median existing-home sales price jumped 5.8% from May 2023 to $419,300 – the highest price ever recorded and the eleventh consecutive month of year-over-year price gains. The inventory of unsold existing homes grew 6.7% from the previous month to 1.28 million at the end of May, or the equivalent of 3.7 months' supply at the current monthly sales pace. " data-src="https://www.nar.realtor/sites/default/files/styles/inline_paragraph_image/public/downloadable/2024-05-existing-home-sales-housing-snapshot-infographic-06-21-2024-1000w-1500h.png?itok=s_A0Ct9n" class="b-lazy" width="1000" height="1501" alt="EHS Housing Snapshot Infographic, May 2024" title="EHS Housing Snapshot Infographic, May 2024"> See and share this infographic. WASHINGTON (June 21, 2024) – Existing-home sales slightly declined in May as the median sales price climbed to a record high, according to the National Association of REALTORS®. In the four major U.S. regions, sales slid month-over-month in the South but were unchanged in the Northeast, Midwest and West. Year-over-year, sales rose in the Midwest but receded in the Northeast, South and West. Total existing-home sales1 – completed transactions that include single-family homes, townhomes, condominiums and co-ops – retreated 0.7% from April to a seasonally adjusted annual rate of 4.11 million in May. Year-over-year, sales waned 2.8% (down from 4.23 million in May 2023). "Eventually, more inventory will help boost home sales and tame home price gains in the upcoming months," said NAR Chief Economist Lawrence Yun. "Increased housing supply spells good news for consumers who want to see more properties before making purchasing decisions." Total housing inventory2 registered at the end of May was 1.28 million units, up 6.7% from April and 18.5% from one year ago (1.08 million). Unsold inventory sits at a 3.7-month supply at the current sales pace, up from 3.5 months in April and 3.1 months in May 2023. The median existing-home price3 for all housing types in May was $419,300, the highest price ever recorded and an increase of 5.8% from one year ago ($396,500). All four U.S. regions registered price gains. "Home prices reaching new highs are creating a wider divide between those owning properties and those who wish to be first-time buyers," Yun added. "The mortgage payment for a typical home today is more than double that of homes purchased before 2020. Still, first-time buyers in the market understand the long-term benefits of owning." REALTORS® Confidence Index According to the monthly REALTORS® Confidence Index, properties typically remained on the market for 24 days in May, down from 26 days in April but up from 18 days in May 2023. First-time buyers were responsible for 31% of sales in May, down from 33% in April but up from 28% in May 2023. NAR's 2023 Profile of Home Buyers and Sellers – released in November 20234 – found that the annual share of first-time buyers was 32%. All-cash sales accounted for 28% of transactions in May, unchanged from April and up from 25% one year ago. Individual investors or second-home buyers, who make up many cash sales, purchased 16% of homes in May, identical to April and up from 15% in May 2023. Distressed sales5 – foreclosures and short sales – represented 2% of sales in May, unchanged from last month and the previous year. Mortgage Rates According to Freddie Mac, the 30-year fixed-rate mortgage averaged 6.87% as of June 20. That's down from 6.95% the prior week but up from 6.67% one year ago. Single-family and Condo/Co-op Sales Single-family home sales declined to a seasonally adjusted annual rate of 3.71 million in May, down 0.8% from 3.74 million in April and 2.1% from the prior year. The median existing single-family home price was $424,500 in May, up 5.7% from May 2023. At a seasonally adjusted annual rate of 400,000 units in May, existing condominium and co-op sales were unchanged from last month and down 9.1% from one year ago (440,000 units). The median existing condo price was $371,300 in May, up 5.1% from the previous year ($353,300). Regional Breakdown Existing-home sales in the Northeast in May were identical to April at an annual rate of 480,000, a decline of 4% from May 2023. The median price in the Northeast was $479,200, up 9.2% from the prior year. In the Midwest, existing-home sales were unchanged from one month ago at an annual rate of 1 million in May, up 1% from one year ago. The median price in the Midwest was $317,100, up 6.4% from May 2023. Existing-home sales in the South fell 1.6% from April to an annual rate of 1.87 million in May, down 5.1% from the previous year. The median price in the South was $374,300, up 3.6% from last year. In the West, existing-home sales in May were equivalent to April at an annual rate of 760,000, a drop of 1.3% from one year before. The median price in the West was $632,900, up 5.5% from May 2023. About the National Association of REALTORS® The National Association of REALTORS® is America's largest trade association, representing 1.5 million members involved in all aspects of the residential and commercial real estate industries. The term REALTOR® is a registered collective membership mark that identifies a real estate professional who is a member of the National Association of REALTORS® and subscribes to its strict Code of Ethics. # # # For local information, please contact the local association of REALTORS® for data from local multiple listing services (MLS). Local MLS data is the most accurate source of sales and price information in specific areas, although there may be differences in reporting methodology. NOTE: NAR's Pending Home Sales Index for May is scheduled for release on June 27, and Existing-Home Sales for June will be released on July 23. Release times are 10 a.m. Eastern. 1 Existing-home sales, which include single-family, townhomes, condominiums and co-ops, are based on transaction closings from Multiple Listing Services. Changes in sales trends outside of MLSs are not captured in the monthly series. NAR benchmarks home sales periodically using other sources to assess overall home sales trends, including sales not reported by MLSs. Existing-home sales, based on closings, differ from the U.S. Census Bureau's series on new single-family home sales, which are based on contracts or the acceptance of a deposit. Because of these differences, it is not uncommon for each series to move in different directions in the same month. In addition, existing-home sales, which account for more than 90% of total home sales, are based on a much larger data sample – about 40% of multiple listing service data each month – and typically are not subject to large prior-month revisions. The annual rate for a particular month represents what the total number of actual sales for a year would be if the relative pace for that month were maintained for 12 consecutive months. Seasonally adjusted annual rates are used in reporting monthly data to factor out seasonal variations in resale activity. For example, home sales volume is normally higher in the summer than in the winter, primarily because of differences in the weather and family buying patterns. However, seasonal factors cannot compensate for abnormal weather patterns. Single-family data collection began monthly in 1968, while condo data collection began quarterly in 1981; the series were combined in 1999 when monthly collection of condo data began. Prior to this period, single-family homes accounted for more than nine out of 10 purchases. Historic comparisons for total home sales prior to 1999 are based on monthly single-family sales, combined with the corresponding quarterly sales rate for condos. 2 Total inventory and month's supply data are available back through 1999, while single-family inventory and month's supply are available back to 1982 (prior to 1999, single-family sales accounted for more than 90% of transactions and condos were measured only on a quarterly basis). 3 The median price is where half sold for more and half sold for less; medians are more typical of market conditions than average prices, which are skewed higher by a relatively small share of upper-end transactions. The only valid comparisons for median prices are with the same period a year earlier due to seasonality in buying patterns. Month-to-month comparisons do not compensate for seasonal changes, especially for the timing of family buying patterns. Changes in the composition of sales can distort median price data. Year-ago median and mean prices sometimes are revised in an automated process if additional data is received. The national median condo/co-op price often is higher than the median single-family home price because condos are concentrated in higher-cost housing markets. However, in a given area, single-family homes typically sell for more than condos as seen in NAR's quarterly metro area price reports. 4 Survey results represent owner-occupants and differ from separately reported monthly findings from NAR's REALTORS® Confidence Index, which include all types of buyers. The annual study only represents primary residence purchases, and does not include investor and vacation home buyers. Results include both new and existing homes. 5 Distressed sales (foreclosures and short sales), days on market, first-time buyers, all-cash transactions and investors are from a monthly survey for the NAR's REALTORS® Confidence Index, posted at nar.realtor.
Read MoreInstant Reaction: Mortgage Rates, June 20, 2024
Facts: The 30-year fixed mortgage rate from Freddie Mac continued with small incremental declines to 6.87% over the last week from 6.95%. At 6.87%, with 20% down, a mortgage payment on the median-priced existing home of $400,000 is $2,101. Last year, the median downpayment for a first-time buyer was 8%; with these metrics, the typical monthly payment would be $2,416. Positive: The CPI has eased somewhat, but the Fed still has a long way to go before cutting interest rates. However, the Fed has left the door open for one rate cut in 2024, which could assist housing affordability. Negative: For today's housing consumers, limited inventory remains even though there is slightly more inventory than last year. If rates come down, more buyers will inevitably join the home-buying market, which could result in bidding wars. Timing a market based only on interest rates may not yield fruitful results.
Read MoreMarch 2024 NAR Real Estate Forecast Summit: Commercial Update
Watch the Video Recording Presentation Slides " data-src="https://cdn.nar.realtor/sites/default/files/styles/wysiwyg_small2/public/2024-03-07-nar-real-estate-forecast-summit-lawrence-yun-presentation-slides-cover-03-07-2024-1300w-731h.png?itok=JF9u0yef" class="b-lazy" width="200" height="112" alt="Cover of Lawrence Yun's slides: Real Estate Market Outlook, March 7, 2024" title="Cover of Lawrence Yun's slides: Real Estate Market Outlook, March 7, 2024"> Real Estate Market Outlook Presented by NAR Chief Economist Lawrence Yun at the NAR Real Estate Forecast Summit: Commercial Update. " data-src="https://cdn.nar.realtor/sites/default/files/styles/wysiwyg_small2/public/2024-03-07-nar-real-estate-forecast-summit-igor-popov-presentation-slides-cover-03-07-2024-1300w-731h.png?itok=0MXuz4BG" class="b-lazy" width="200" height="112" alt="Cover of Igor Popov's slides: The 2024 Rental Market, March 7, 2024" title="Cover of Igor Popov's slides: The 2024 Rental Market, March 7, 2024"> The 2024 Rental Market Presented by Igor Popov at the NAR Real Estate Forecast Summit: Commercial Update. Report: Markets With the Most Pent-up Housing Demand NAR considered indicators that influence a metro area's market in identifying markets which will experience stronger activity in 2024. Get the report --> Speakers Gregory J. Hrabcak, 2024 Treasurer, National Association of REALTORS® Igor Popov, DChief Economist and Head of Product Analytics, Apartment List Dr. Lawrence Yun, Chief Economist and Senior Vice President of Research, National Association of REALTORS®
Read MoreMetro Areas Producing More Housing Than Their Historical Average
by NAR Research staff Understanding Trends in Single-Family Building Permits Across Metro Areas The housing market has always been one of the main drivers of our country's economic activity. Limited housing supply is one of the main reasons behind rising home prices, declining affordability, and constrained housing activity. Therefore, understanding its dynamics can provide valuable insights for policymakers, developers, and investors. The National Association of REALTORS® closely monitors housing production at the local level using various metrics. At the same time, there are multiple ways to estimate the necessary number of homes that our country needs. NAR compares these in the quarterly Local Market Reports, which show the current levels with the historical average to identify where housing is increasing faster, or housing construction is lagging. This analysis of single-family permits across various metro areas reveals significant trends and variations, shedding light on the current state and historical context of housing construction in the United States. Housing Construction at the National Level Before delving into each local market, at the national level, housing construction peaked in 2005 with over 2 million housing starts. Then construction bottomed out in 2009 with about 550,000 housing starts, while the historical average is about 1.5 million starts. Since its peak in 2005, the country returned to the historical average level in 2021 and 2022. While construction fell again below the average level in 2023, the country is currently building about 900,000 more homes than its lowest level. Considering the historical average level of housing construction and 14 years of underproduction, it's estimated that our country still lacks 4.7 million homes. Production of Housing at the Metro Area Level At the local level, certain areas stand out for their increased construction activity, producing more housing than their historical averages. This trend can be attributed to various factors such as economic growth, population influx, and urban development initiatives. In this analysis, we explore metro areas that are currently producing more single-family housing than their historical norms based on recent permit data. To do that, we computed the number of single-family building permits issued over a 12-month period across 261 metro areas. Key metrics include the maximum number of permits issued within a year, the date and year when this peak occurred, the current number of single-family permits, and the historical average levels of single-family permits. By examining these metrics, we can discern patterns and shifts in the local housing market. Key Findings Maximum Single-Family Building Permit Levels and Peaks Since metro areas of different sizes are included in this analysis, the data shows substantial variability in the maximum number of single-family permits issued within a 12-month period, ranging from as few as 54 permits (Wheeling, WV-OH) to an astonishing 60,912 single-family permits (Atlanta-Sandy Springs-Alpharetta, GA). On average, most metro areas reached their peak permit levels around 2006, a period marked by significant construction activity before the 2008 financial crisis. Current Level of Housing Construction Activity Among the 261 studied metro areas, housing construction currently varies from only 13 single-family permits - Wheeling, WV-OH – to 52,953 in Houston-The Woodlands-Sugar Land, TX, issued within a year. Comparative Analysis: Current vs. Historical Level of Housing Construction On average, metro areas are seeing an 18% increase in current single-family permits compared to historical averages, indicating a slight uptick in housing construction. This increase is crucial for addressing housing shortages in many metro areas. Top-Performing Metro Areas Several metro areas exhibit significant increases in housing production. Here are a few notable examples: Based on the Number of Additional Single-Family Permits Houston and Dallas metro areas in Texas are the top two areas with the most additional single-family permits compared to their historical averages. These two metro areas currently issue more than 11,000 single-family permits within a year above the historical average. Charlotte, North Carolina, follows with about 6,200 additional single-family permits. An unexpectedly good finding was that a few metro areas are producing more single-family housing than ever before. Punta Gorda, FL, Panama City, FL, and Fayetteville, AR-MO are the top three metro areas issuing more single-family permits than ever before. For example, the Punta Gorda, FL market currently issues about 356 more single-family permits. In addition, nearly 190 more single-family permits have been issued in the Fayetteville, AR-MO metro area within the last 12 months ending in April. Based on the Percentage Increase Another way to identify the areas with the most gains in single-family construction is to compare the percentage increase from their historical averages. This method can be used to capture smaller metro areas, while the previous method showed the areas with the largest number of additional single-family permits. Indeed, data shows that smaller areas – such as Lakeland and Ocala metro areas in Florida and Fayetteville, AR-MO – issue more than twice the number of single-family permits yearly compared to their historical averages. Areas Where Housing Construction is Most Delayed In contrast, many other metro areas are also struggling to wrap up housing production. Chicago, IL-IN-WI, Washington, D.C.-VA-MD-WV, and Seattle, WA, are the three metro areas with the largest number of single-family permits below the historical average level. For example, the historical level of single-family permit issuance in the Chicago metro area is about 14,690 permits per year, but this area is currently issuing only 8,660 single-family permits within the last 12-month period. Using the percentage difference between the current and historical levels, smaller metro areas also underproduce. Specifically, Anchorage, AK, Rockford, IL, and Bismarck, ND, issue 60%+ below the historical average level. For instance, Anchorage, AK, issued fewer than 200 single-family permits in the last 12 months, while the historical average is about 700 permits per year. Do Larger or Smaller Metro Areas Lag Behind Historical Levels of Single-Family Permits? Understanding whether larger or smaller metro areas are lagging behind their historical levels of single-family permits can offer valuable insights into regional housing market dynamics. In this analysis, we also explore the trends in building permits across different metro areas, examining whether size plays a role in meeting or exceeding historical averages. For this analysis, the metro areas were categorized into "larger" and "smaller" based on their historical average permit levels, providing a clear comparison. Thus: Larger Metro Areas: These areas have historically high levels of single-family building permits (at least 830 single-family permits within a year). Smaller Metro Areas: These areas have historically lower levels of single-family building permits (less than 830 single-family permits within a year). The analysis reveals that larger metro areas, despite their historical dominance in housing production, are currently lagging behind their historical averages. With only a 9.3% increase in permits, these areas seem to face several challenges to wrap up housing production. Stricter zoning laws and building regulations can slow down new housing developments. At the same time, the cost of land and construction in larger metro areas tends to be higher, potentially deterring new projects. Consider a metro area like Oklahoma City, OK, with a historical average of around 5,490 permits within 12 months. Despite its size, the current trend shows a modest increase of 3% above the historical average. Another example with an even larger metro area is the Atlanta-Sandy Springs-Alpharetta, GA metro area, which currently issues 9% – 2,612 single-family permits – below its historical average level. In contrast, smaller metro areas are significantly outperforming their historical averages, with a 26.1% (on average) increase in single-family building permits. This robust growth can be attributed to several factors, such as more available land and less competition, making these areas attractive for new developments. In addition, many smaller metro areas have implemented policies to encourage growth, such as tax incentives for builders and streamlined permitting processes. Take Abilene, TX, with a historical average of approximately 272 permits: It has recently seen a significant increase to 338 permits (up 24% from the historical average), demonstrating how smaller metro areas leverage growth opportunities. The data reveals a clear trend: Smaller metro areas lead in single-family home construction, significantly outpacing their historical averages. In contrast, larger metro areas, while still growing to meet demand, are lagging behind their historical performance. By continuing to monitor these trends, policymakers can better anticipate changes in the housing market, address potential shortages, and support sustainable growth. Please visit NAR's Local Market Reports for a more detailed breakdown of specific metro areas or further analysis. by NAR Research staff Understanding Trends in Single-Family Building Permits Across Metro Areas The housing market has always been one of the main drivers of our country's economic activity. Limited housing supply is one of the main reasons behind rising home prices, declining affordability, and constrained housing activity. Therefore, understanding its dynamics can provide valuable insights for policymakers, developers, and investors. The National Association of REALTORS® closely monitors housing production at the local level using various metrics. At the same time, there are multiple ways to estimate the necessary number of homes that our country needs. NAR compares these in the quarterly Local Market Reports, which show the current levels with the historical average to identify where housing is increasing faster, or housing construction is lagging. This analysis of single-family permits across various metro areas reveals significant trends and variations, shedding light on the current state and historical context of housing construction in the United States. Housing Construction at the National Level Before delving into each local market, at the national level, housing construction peaked in 2005 with over 2 million housing starts. Then construction bottomed out in 2009 with about 550,000 housing starts, while the historical average is about 1.5 million starts. Since its peak in 2005, the country returned to the historical average level in 2021 and 2022. While construction fell again below the average level in 2023, the country is currently building about 900,000 more homes than its lowest level. Considering the historical average level of housing construction and 14 years of underproduction, it's estimated that our country still lacks 4.7 million homes. Production of Housing at the Metro Area Level At the local level, certain areas stand out for their increased construction activity, producing more housing than their historical averages. This trend can be attributed to various factors such as economic growth, population influx, and urban development initiatives. In this analysis, we explore metro areas that are currently producing more single-family housing than their historical norms based on recent permit data. To do that, we computed the number of single-family building permits issued over a 12-month period across 261 metro areas. Key metrics include the maximum number of permits issued within a year, the date and year when this peak occurred, the current number of single-family permits, and the historical average levels of single-family permits. By examining these metrics, we can discern patterns and shifts in the local housing market. Key Findings Maximum Single-Family Building Permit Levels and Peaks Since metro areas of different sizes are included in this analysis, the data shows substantial variability in the maximum number of single-family permits issued within a 12-month period, ranging from as few as 54 permits (Wheeling, WV-OH) to an astonishing 60,912 single-family permits (Atlanta-Sandy Springs-Alpharetta, GA). On average, most metro areas reached their peak permit levels around 2006, a period marked by significant construction activity before the 2008 financial crisis. Current Level of Housing Construction Activity Among the 261 studied metro areas, housing construction currently varies from only 13 single-family permits - Wheeling, WV-OH – to 52,953 in Houston-The Woodlands-Sugar Land, TX, issued within a year. Comparative Analysis: Current vs. Historical Level of Housing Construction On average, metro areas are seeing an 18% increase in current single-family permits compared to historical averages, indicating a slight uptick in housing construction. This increase is crucial for addressing housing shortages in many metro areas. Top-Performing Metro Areas Several metro areas exhibit significant increases in housing production. Here are a few notable examples: Based on the Number of Additional Single-Family Permits Houston and Dallas metro areas in Texas are the top two areas with the most additional single-family permits compared to their historical averages. These two metro areas currently issue more than 11,000 single-family permits within a year above the historical average. Charlotte, North Carolina, follows with about 6,200 additional single-family permits. An unexpectedly good finding was that a few metro areas are producing more single-family housing than ever before. Punta Gorda, FL, Panama City, FL, and Fayetteville, AR-MO are the top three metro areas issuing more single-family permits than ever before. For example, the Punta Gorda, FL market currently issues about 356 more single-family permits. In addition, nearly 190 more single-family permits have been issued in the Fayetteville, AR-MO metro area within the last 12 months ending in April. Based on the Percentage Increase Another way to identify the areas with the most gains in single-family construction is to compare the percentage increase from their historical averages. This method can be used to capture smaller metro areas, while the previous method showed the areas with the largest number of additional single-family permits. Indeed, data shows that smaller areas – such as Lakeland and Ocala metro areas in Florida and Fayetteville, AR-MO – issue more than twice the number of single-family permits yearly compared to their historical averages. Areas Where Housing Construction is Most Delayed In contrast, many other metro areas are also struggling to wrap up housing production. Chicago, IL-IN-WI, Washington, D.C.-VA-MD-WV, and Seattle, WA, are the three metro areas with the largest number of single-family permits below the historical average level. For example, the historical level of single-family permit issuance in the Chicago metro area is about 14,690 permits per year, but this area is currently issuing only 8,660 single-family permits within the last 12-month period. Using the percentage difference between the current and historical levels, smaller metro areas also underproduce. Specifically, Anchorage, AK, Rockford, IL, and Bismarck, ND, issue 60%+ below the historical average level. For instance, Anchorage, AK, issued fewer than 200 single-family permits in the last 12 months, while the historical average is about 700 permits per year. Do Larger or Smaller Metro Areas Lag Behind Historical Levels of Single-Family Permits? Understanding whether larger or smaller metro areas are lagging behind their historical levels of single-family permits can offer valuable insights into regional housing market dynamics. In this analysis, we also explore the trends in building permits across different metro areas, examining whether size plays a role in meeting or exceeding historical averages. For this analysis, the metro areas were categorized into "larger" and "smaller" based on their historical average permit levels, providing a clear comparison. Thus: Larger Metro Areas: These areas have historically high levels of single-family building permits (at least 830 single-family permits within a year). Smaller Metro Areas: These areas have historically lower levels of single-family building permits (less than 830 single-family permits within a year). The analysis reveals that larger metro areas, despite their historical dominance in housing production, are currently lagging behind their historical averages. With only a 9.3% increase in permits, these areas seem to face several challenges to wrap up housing production. Stricter zoning laws and building regulations can slow down new housing developments. At the same time, the cost of land and construction in larger metro areas tends to be higher, potentially deterring new projects. Consider a metro area like Oklahoma City, OK, with a historical average of around 5,490 permits within 12 months. Despite its size, the current trend shows a modest increase of 3% above the historical average. Another example with an even larger metro area is the Atlanta-Sandy Springs-Alpharetta, GA metro area, which currently issues 9% – 2,612 single-family permits – below its historical average level. In contrast, smaller metro areas are significantly outperforming their historical averages, with a 26.1% (on average) increase in single-family building permits. This robust growth can be attributed to several factors, such as more available land and less competition, making these areas attractive for new developments. In addition, many smaller metro areas have implemented policies to encourage growth, such as tax incentives for builders and streamlined permitting processes. Take Abilene, TX, with a historical average of approximately 272 permits: It has recently seen a significant increase to 338 permits (up 24% from the historical average), demonstrating how smaller metro areas leverage growth opportunities. The data reveals a clear trend: Smaller metro areas lead in single-family home construction, significantly outpacing their historical averages. In contrast, larger metro areas, while still growing to meet demand, are lagging behind their historical performance. By continuing to monitor these trends, policymakers can better anticipate changes in the housing market, address potential shortages, and support sustainable growth. Please visit NAR's Local Market Reports for a more detailed breakdown of specific metro areas or further analysis.
Read MoreMortgage Rates and Higher Home Prices Continue to Hinder Affordability in April 2024
At the national level, housing affordability faded in April compared to the previous month, according to NAR’s Housing Affordability Index. Compared to the prior month, the monthly mortgage payment increased by 5.7%, while the median price of single-family homes increased by 0.1%. The monthly mortgage payment increased by $119 from last month. Compared to one year ago, affordability fell in April as the monthly mortgage payment climbed 12.9% and median family income rose by 5.0%. The effective 30-year fixed mortgage rate was 7.07% this March compared to 6.42% one year ago. Nationally, mortgage rates were up 65 basis points from one year ago (one percentage point equals 100 basis points). Mortgage rates moved above 7% for the first time since last year, November 2023. The median existing-home sales price rose 5.6% to $412,100 compared to one year ago ($390,200). " data-src="https://cdn.nar.realtor/sites/default/files/styles/inline_paragraph_image/public/economists-outlook-housing-affordability-index-april-2023-to-april-2024-line-graph-06-17-2024-1300w-602h.png?itok=UrEhcK8P" class="b-lazy" width="1200" height="556" alt="Line graph: Housing Affordability Index, April 2023 to April 2024" title="Line graph: Housing Affordability Index, April 2023 to April 2024"> " data-src="https://cdn.nar.realtor/sites/default/files/styles/inline_paragraph_image/public/economists-outlook-median-family-income-vs-qualifying-income-april-2023-to-april-2024-line-graph-06-17-2024-1300w-602h.png?itok=RbL1qUwV" class="b-lazy" width="1200" height="556" alt="Line graph: Median Family Income vs Qualifying Income, April 2023 to April 2024" title="Line graph: Median Family Income vs Qualifying Income, April 2023 to April 2024"> " data-src="https://cdn.nar.realtor/sites/default/files/styles/inline_paragraph_image/public/economists-outlook-mortgage-rates-april-2023-to-april-2024-bar-graph-06-17-2024-1300w-588h.png?itok=i2ScYJNT" class="b-lazy" width="1200" height="543" alt="Bar graph: Mortgage Rates, April 2023 to April 2024" title="Bar graph: Mortgage Rates, April 2023 to April 2024"> The national index is currently below 100, which means that the typical family cannot afford to buy based on the median-priced home. An index below 100 means that a family with a median income had less than the income required to afford a median-priced home. The income required to afford a mortgage, or the qualifying income is the income needed so that mortgage payments on a 30-year fixed mortgage loan with a 20% down payment account for 25% of family income. The most affordable region was the Midwest, with an index value of 125.8 (median family income of $99,069 with a qualifying income of $78,720). The least affordable region remained the West, where the index was 65.3 (median family income of $110,962 and qualifying income of $164,928). The South was the second most affordable region with an index of 97.7 (median family income of $93,626 and qualifying income of $95,808). The Northeast was the second most unaffordable region with an index of 94.7 (median family income of $113,722 with a qualifying income of $120,144). A mortgage is affordable if the mortgage payment (principal and interest) amounts to 25% or less of the family’s income. " data-src="https://cdn.nar.realtor/sites/default/files/styles/inline_paragraph_image/public/economists-outlook-us-and-regional-april-housing-affordability-2024-and-2023-bar-graph-06-17-2024-1300w-583h.png?itok=o0Kh7NyV" class="b-lazy" width="1200" height="538" alt="Bar graph: U.S. and Regional April Housing Affordability, 2024 and 2023" title="Bar graph: U.S. and Regional April Housing Affordability, 2024 and 2023"> " data-src="https://cdn.nar.realtor/sites/default/files/styles/inline_paragraph_image/public/economists-outlook-us-and-regional-median-family-income-and-qualifying-income-bar-graph-06-17-2024-1300w-561h.png?itok=TR69rby_" class="b-lazy" width="1200" height="518" alt="Bar graph: U.S. and Regional Median Family Income and Qualifying Income" title="Bar graph: U.S. and Regional Median Family Income and Qualifying Income"> Housing affordability declined in all four regions from a year ago. The Northeast region experienced the biggest decline of 10%, followed by the West, with a dip of 9.4%. The Midwest experienced a weakening in price growth of 7.4%, followed by the South, which fell 5.1%. Affordability fell in all four regions from last month. The Northeast region had the biggest decline of 7.2%. The Midwest and the West both shared a decrease of 5.3%. The South region had a reduction of 4.0%. Compared to one year ago, the monthly mortgage payment rose to $2,209 from $1,957, an increase of 12.9%, or $252. The annual mortgage payment as a percentage of income inclined to 26.1% this April from 24.3% compared to a year ago. Regionally, the West has the highest mortgage payment to income share at 37.2 of income. The Northeast had the second-highest share at 26.4%, followed by the South at 25.6%. The Midwest had the lowest mortgage payment as a percentage of income at 19.9%. Mortgage payments are not burdensome if they are no more than 25% of income. " data-src="https://cdn.nar.realtor/sites/default/files/styles/inline_paragraph_image/public/economists-outlook-monthly-mortgage-payments-april-2023-to-april-2024-line-graph-06-17-2024-1300w-663h.png?itok=daPYY0Gr" class="b-lazy" width="1200" height="612" alt="Line graph: Monthly Mortgage Payments, April 2023 to April 2024" title="Line graph: Monthly Mortgage Payments, April 2023 to April 2024"> " data-src="https://cdn.nar.realtor/sites/default/files/styles/inline_paragraph_image/public/economists-outlook-median-home-prices-april-2023-to-april-2024-line-graph-06-17-2024-1300w-670h.png?itok=8uwqcUOb" class="b-lazy" width="1200" height="618" alt="Line graph: Median Home Prices, April 2023 to April 2024" title="Line graph: Median Home Prices, April 2023 to April 2024"> This week, the Mortgage Bankers Association reported that mortgage applications increased 13.8% from one week prior and 15.6% from one week earlier. Higher mortgage rates are hiking up monthly mortgage payments. Qualifying incomes are climbing and outpacing median family incomes. Home price growth has continued to present challenges, pushing out potential home buyers. Lower rates will help relieve some of the pressure on family incomes. See the full data release. The Housing Affordability Index calculation assumes a 20% down payment and a 25% qualifying ratio (principal and interest payment to income). See further details on the methodology and assumptions behind the calculation.
Read MoreInstant Reaction: CPI, June 12, 2024
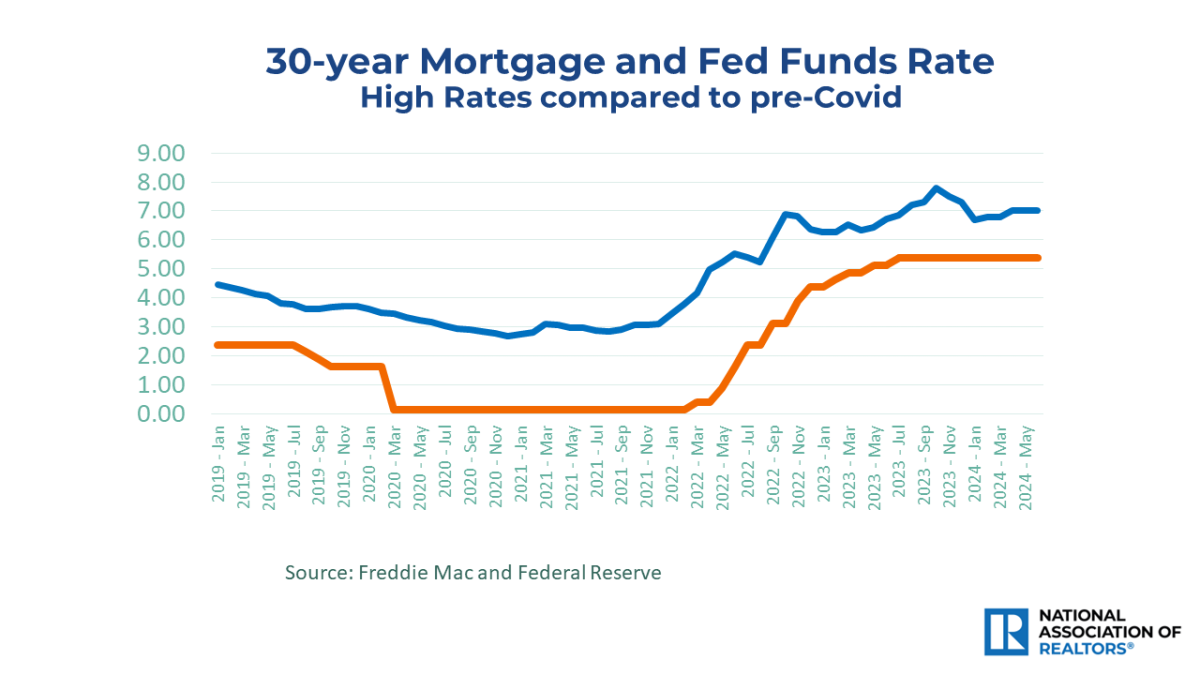
Inflation is moving in the right direction, but it is not quite at the point for the Fed to cut interest rates. The all-important consumer price inflation rose by 3.3% from a year ago. “Core” inflation decelerated to 3.4%, its slowest gain in three years. The target is 2% inflation. The recent peak inflation rate of 9% two years ago was a shocker, precipitating the aggressive interest hike policy by the Fed. The central bank can reverse that policy as better inflation figures continue in the upcoming months. The shelter component is the heavyweight driver, and it was up 5.4%; still high but the slowest gain in two years. The non-official private sector data points to rising apartment vacancy rates from temporary oversupply, and rents are essentially showing no increases. So, official consumer price inflation, with a lag time, no doubt has more room to slow down. The timing of the first rate cut is uncertain. But the longer-term outlook is for the Fed to cut interest rates 6 to 8 rounds by the end of next year. Home prices will remain solid, and home sales will pick up, especially in regions with rising inventory. " data-src="https://cdn.nar.realtor/sites/default/files/styles/inline_paragraph_image/public/economists-outlook-30-year-mortgage-and-fed-funds-rate-january-2019-to-may-2024-line-graph-06-12-2024-1280w-720h.png?itok=lJOrP6hY" class="b-lazy" width="1200" height="675" alt="Line graph: 30-year Mortgage and Fed Funds Rate, January 2019 to May 2024" title="Line graph: 30-year Mortgage and Fed Funds Rate, January 2019 to May 2024"> " data-src="https://cdn.nar.realtor/sites/default/files/styles/inline_paragraph_image/public/economists-outlook-cpi-and-core-cpi-january-2019-to-may-2024-line-graph-06-12-2024-1280w-720h.png?itok=cm46RfnV" class="b-lazy" width="1200" height="675" alt="Line graph: CPI and Core CPI, January 2019 to May 2024" title="Line graph: CPI and Core CPI, January 2019 to May 2024"> " data-src="https://cdn.nar.realtor/sites/default/files/styles/inline_paragraph_image/public/economists-outlook-annual-apartment-construction-2000-to-2023-bar-graph-06-12-2024-1280w-720h.png?itok=qtHHs-pO" class="b-lazy" width="1200" height="675" alt="Bar graph: nnual Apartment Construction, 2000 to 2023" title="Bar graph: nnual Apartment Construction, 2000 to 2023"> " data-src="https://cdn.nar.realtor/sites/default/files/styles/inline_paragraph_image/public/economists-outlook-private-sector-data-on-apartment-vacancy-rate-2017-to-2024-bar-graph-06-12-2024-1280w-720h.png?itok=PQxNIZD2" class="b-lazy" width="1200" height="675" alt="Bar graph: Private Sector Data on Apartment Vacancy Rates, 2017 to 2024" title="Bar graph: Private Sector Data on Apartment Vacancy Rates, 2017 to 2024"> " data-src="https://cdn.nar.realtor/sites/default/files/styles/inline_paragraph_image/public/economists-outlook-official-government-data-vs-unofficial-private-sector-data-on-rent-rates-q1-2022-to-q2-2024-line-graph-06-12-2024-1280w-720h.png?itok=2KwirepO" class="b-lazy" width="1200" height="675" alt="Line graph: Official Government Data vs Unofficial Private Sector Data on Rent Rates, Q1 2022 to Q2 2024" title="Line graph: Official Government Data vs Unofficial Private Sector Data on Rent Rates, Q1 2022 to Q2 2024"> " data-src="https://cdn.nar.realtor/sites/default/files/styles/inline_paragraph_image/public/economists-outlook-new-car-prices-and-auto-insurance-rates-january-2019-to-may-2024-line-graph-06-12-2024-1280w-720h.png?itok=TqRo8719" class="b-lazy" width="1200" height="675" alt="Line graph: New Car Prices and Auto Insurance Rates, January 2019 to May 2024" title="Line graph: New Car Prices and Auto Insurance Rates, January 2019 to May 2024">
Read MoreServing the REALTOR® Community for 100+ Years
“This is where our history lives. This is where our future lives.” Since 1923, the Library & Archives has been dedicated to providing NAR’s members with resources and services to help them stay at the forefront of real estate knowledge. a#white-header:hover{color: white; background-color: #35a0ea; display: inline;} " data-src="https://cdn.nar.realtor/sites/default/files/styles/inline_paragraph_image/public/youtube-icon-45w32h.png?itok=CKtHOzk_" class="b-lazy" width="45" height="32" alt="YouTube Play Button Icon"> NAR Videos on YouTube NAR offers additional topics online covering legislation, events, industry news and guides for both NAR members and the public. Visit NAR on YouTube National Association of REALTORS® 25.6K subscribers Open YouTube REALTOR® Party 1.82K subscribers Open YouTube REALTOR® Magazine 3.96K subscribers Open YouTube NAR Meetings 1.85K subscribers Open YouTube Realtors Property Resource® (RPR) 13.4K subscribers Open YouTube HouseLogic 1.46K subscribers Open YouTube First-Time Buyer 3.7K subscribers Open YouTube That’s Who We R (playlist) Open YouTube
Read MoreEssential Insights Into Industry Trends With Elizabeth Mendenhall
Elizabeth Mendenhall, 2018 NAR President, explains how she used the Library & Archives to help inform a Strategic Planning Committee project and recommends its services to her new agents to gain an edge in the business. a#white-header:hover{color: white; background-color: #35a0ea; display: inline;} " data-src="https://cdn.nar.realtor/sites/default/files/styles/inline_paragraph_image/public/youtube-icon-45w32h.png?itok=CKtHOzk_" class="b-lazy" width="45" height="32" alt="YouTube Play Button Icon"> NAR Videos on YouTube NAR offers additional topics online covering legislation, events, industry news and guides for both NAR members and the public. Visit NAR on YouTube National Association of REALTORS® 25.6K subscribers Open YouTube REALTOR® Party 1.82K subscribers Open YouTube REALTOR® Magazine 3.96K subscribers Open YouTube NAR Meetings 1.85K subscribers Open YouTube Realtors Property Resource® (RPR) 13.4K subscribers Open YouTube HouseLogic 1.46K subscribers Open YouTube First-Time Buyer 3.7K subscribers Open YouTube That’s Who We R (playlist) Open YouTube
Read MoreInstant Reaction: Jobs, June 7, 2024
Job additions are continuing at a healthy clip. A net of 272,000 payroll jobs were added to the economy in May, which is an acceleration from recent months. However, unemployment ticked higher, to 4.0%, due to a different measurement showing a net 408,000 jobs having disappeared when based on a household survey rather than a company survey. Wage growth of 4.1% is respectable and better than the 3.4% consumer price inflation. Americans, however, have not shown recognition, according to many polls, of an improving economy, which no doubt is due to the fact that the cumulative rise in consumer prices is still higher than the cumulative wage gain of the past 4 years. Payroll data is considered much more reliable than household survey data. That is why Wall Street is expecting a further delay in the Fed's interest rate cut. The mortgage rate looks to be stuck at near 7% average for at least another month. " data-src="https://cdn.nar.realtor/sites/default/files/styles/inline_paragraph_image/public/economists-outlook-total-payroll-jobs-january-2020-to-may-2024-bar-graph-06-07-2024-1280w-720h.png?itok=6zAPQGIy" class="b-lazy" width="1200" height="675" alt="Bar graph: Total Payroll Jobs, January 2020 to May 2024" title="Bar graph: Total Payroll Jobs, January 2020 to May 2024"> " data-src="https://cdn.nar.realtor/sites/default/files/styles/inline_paragraph_image/public/economists-outlook-monthly-net-payroll-job-additions-january-2022-to-may-2024-bar-graph-1280w-720h.png?itok=TnNZZ3f4" class="b-lazy" width="1200" height="675" alt="Bar graph: Monthly Net Payroll Job Additons, January 2022 to May 2024" title="Bar graph: Monthly Net Payroll Job Additons, January 2022 to May 2024"> " data-src="https://cdn.nar.realtor/sites/default/files/styles/inline_paragraph_image/public/economists-outlook-monthly-net-household-job-additions-january-2022-to-may-2024-bar-graph-06-07-2024-1280w-720h.png?itok=Pfc1tU3r" class="b-lazy" width="1200" height="675" alt="Bar graph: Monthly Net Household Job Additions, January 2022 to May 2024" title="Bar graph: Monthly Net Household Job Additions, January 2022 to May 2024"> " data-src="https://cdn.nar.realtor/sites/default/files/styles/inline_paragraph_image/public/economists-outlook-unemployment-rate-january-2000-to-january-2024-line-graph-06-07-2024-1280w-720h.png?itok=SJfY-F2V" class="b-lazy" width="1200" height="675" alt="Line graph: Unemployment Rate, January 2000 to January 2024" title="Line graph: Unemployment Rate, January 2000 to January 2024"> " data-src="https://cdn.nar.realtor/sites/default/files/styles/inline_paragraph_image/public/economists-outlook-wage-gain-and-cpi-january-2021-to-may-2024-line-graph-06-07-2024-1280w-720h.png?itok=1RihTujM" class="b-lazy" width="1200" height="675" alt="Line graph: Wage Gain and CPI, January 2021 to May 2024" title="Line graph: Wage Gain and CPI, January 2021 to May 2024"> " data-src="https://cdn.nar.realtor/sites/default/files/styles/inline_paragraph_image/public/economists-outlook-job-gains-since-pre-covid-record-high-payroll-employment-march-2020-to-april-2024-us-map-06-07-2024-1280w-720h.png?itok=mjbwcNxj" class="b-lazy" width="1200" height="675" alt="U.S. Map: Job Gains Since Pre-COVID Record-high Payroll Employment, March 2020 to April 2024" title="U.S. Map: Job Gains Since Pre-COVID Record-high Payroll Employment, March 2020 to April 2024">
Read MoreUS Pending Home Sales Gauge Slumps in April to Four-Year Low –Bloomberg News
Bloomberg News A gauge of pending U.S. existing-home sales tumbled to a four-year low in April as higher mortgage rates cast a pall on the spring selling season. An index of contract signings from the National Association of REALTORS® dropped 7.7% to 72.3, the lowest reading since the early months of the pandemic. The monthly decline was steeper than all estimates in a Bloomberg survey of economists and the worst since February 2021. All US regions saw decreases from a month earlier. "The impact of escalating interest rates throughout April dampened home buying, even with more inventory in the market," NAR Chief Economist Lawrence Yun said in a statement. "But the Federal Reserve’s anticipated rate cut later this year should lead to better conditions, with improved affordability and more supply." "The prospect of measurable home price declines appears minimal," Yun said. "The few markets experiencing price declines will be viewed as second-chance opportunities for buyers to enter the market if those regions continue to add jobs." Read the full article
Read MoreInstant Reaction: Mortgage Rates, June 6, 2024
Facts: The 30-year fixed mortgage rate from Freddie Mac eased slightly to 6.99% over the last week from 7.03%. At 6.99%, with 20% down, a mortgage payment on the median-priced existing home of $400,000 is $2,127. In the most expensive MSA of San Jose-Sunnyvale-Santa Clara, CA (median price of $1,840,000), the monthly mortgage payment is $9,783 (jumbo loan not factored in). In the most affordable MSA of Decatur, IL (median price $122,800), the monthly mortgage payment is $653. Positive: Real estate is local. A home buyer can improve their credit score, debt-to-income ratio, and lower an interest rate provided by the bank. Mortgage rates are one variable in a larger equation. Negative: While there is hope that the FOMC's federal funds rate will be lower by the fall of 2024, most believe it will not move next week. But there is even more pressure: The European Central Bank and Bank of Canada have cut rates. When is it the U.S.’s turn?
Read MoreMay 2024 Commercial Real Estate Market Insights
" data-src="https://cdn.nar.realtor/sites/default/files/styles/wysiwyg_small2/public/2024-05-commercial-real-estate-market-insights-report-cover-06-03-2024-300w-433h.png?itok=h-KjEsOQ" class="b-lazy" width="200" height="289" alt="Cover of the May 2024 Commercial Real Estate Market Insights report" title="Cover of the May 2024 Commercial Real Estate Market Insights report"> Download PDF The commercial real estate (CRE) market entered the second quarter of the year with persistently rising vacancy rates and slowing rent growth across most market sectors. Specifically, the office vacancy rate reached new record highs, approaching nearly 14%, while fundamentals in retail and industrial sectors decelerated. High interest rates and the effects of hybrid work on office spaces are the main factors that continue to hamper this sector. In the meantime, the U.S. economy started to slow down after previously exceeding expectations, reflecting the impact of inflation pressures on consumers. Office Properties At the beginning of the year's second quarter, fewer additional office spaces were vacated than occupied for the first time since the end of 2022. Even though net absorption remains negative with more vacated than occupied office spaces, this is the first time the gap between vacated and occupied office spaces has narrowed. However, the vacancy rate rose even further to 13.8% in April 2024. Looking ahead, the forecast suggests a persistent increase in available office spaces. Leasing activity, which helps to gauge the level of demand and interest from potential tenants, is about 30 percentage points below the pre-pandemic levels. " data-src="https://cdn.nar.realtor/sites/default/files/styles/inline_paragraph_image/public/12-month-net-office-absorption-in-square-feet-q1-2021-to-q2-2024-bar-graph-06-03-2024-852w-814h.png?itok=nrCKMx0M" class="b-lazy" width="852" height="814" alt="Bar graph: 12-Month Net Office Absorption in Square Feet, Q1 2021 to Q2 2024" title="Bar graph: 12-Month Net Office Absorption in Square Feet, Q1 2021 to Q2 2024"> Multifamily Properties On the other hand, high mortgage rates, hovering around 7%, continue to keep strong demand for apartment buildings. The multifamily sector not only rebounded from the lows it experienced last year, but net absorption is more than double that of the same period a year ago. This translates to more than twice of the additional occupied rental units than vacated compared to last April. Nevertheless, even with this strong demand, the vacancy rate remained at 7.8%. This is mainly due to the influx of new rental housing supply entering the market after the record highs in apartment construction over the past couple of years. The completion of these additional rental units has absorbed the higher demand and prevented vacancy rates from easing. " data-src="https://cdn.nar.realtor/sites/default/files/styles/inline_paragraph_image/public/top-10-areas-with-the-strongest-multifamily-absorption-q2-2024-and-q2-2023-table-06-03-2024-904w-1140h.png?itok=E8acxxKk" class="b-lazy" width="904" height="1140" alt="Table: Top 10 Areas With the Strongest Multifamily Absorption, Q2 2024 and Q2 2023" title="Table: Top 10 Areas With the Strongest Multifamily Absorption, Q2 2024 and Q2 2023"> Retail Properties Demand for retail spaces remained below the pre-pandemic levels as net absorption slowed further in April. Compared to a year ago, net absorption is significantly lower by approximately 30 percentage points. However, the limited availability of retail spaces keeps vacancy rates low, hovering around 4%, the lowest rate among any other sector in the commercial real estate market. With new construction deliveries likely to diminish even further, the fundamentals of this sector are expected to remain solid in 2024. " data-src="https://cdn.nar.realtor/sites/default/files/styles/inline_paragraph_image/public/12-month-net-retail-absorption-by-type-q1-2014-to-q2-2024-line-graph-06-03-2024-1300w-564h.png?itok=7Yh5Zjrx" class="b-lazy" width="1200" height="521" alt="Line graph: 12-Month Net Retail Absorption by Type, Q1 2014 to Q2 2024" title="Line graph: 12-Month Net Retail Absorption by Type, Q1 2014 to Q2 2024"> Industrial Properties The industrial sector couldn't escape the impact, with demand for industrial spaces also decelerating. Net absorption has dropped to levels not seen in over a decade. After reaching record-high levels at the end of 2021 and the beginning of 2022, fueled by the need for warehouse spaces to accommodate online shopping and e-commerce demands, net absorption is 63% lower than a year ago and 52% below the pre-pandemic average level. However, this sector continues to experience the fastest rent growth compared to any other sector in the commercial real estate market. Specifically, rents for industrial spaces are 4.7% higher than a year ago. The outlook for the industrial real estate market remains positive, driven by factors such as the lasting impact of e-commerce and robust construction spending. " data-src="https://cdn.nar.realtor/sites/default/files/styles/inline_paragraph_image/public/top-10-areas-with-the-strongest-industrial-absorption-q2-2024-and-q2-2023-table-06-03-2024-844w-1012h.png?itok=8GYPP5Km" class="b-lazy" width="844" height="1012" alt="Table: Top 10 Areas With the Strongest 12-Month Industrial Absorption, Q2 2024 and Q2 2023" title="Table: Top 10 Areas With the Strongest 12-Month Industrial Absorption, Q2 2024 and Q2 2023"> Hotel Properties As we move further into 2024, the hospitality industry is showing improvement. Hotel occupancy rates have stabilized around 63%, which is still about 3% below pre-pandemic levels. This suggests that full recovery may be elusive due to the rise of remote work tools like Zoom. However, average daily rates (ADR) and revenue per available room (RevPAR) now surpass pre-pandemic levels. " data-src="https://cdn.nar.realtor/sites/default/files/styles/inline_paragraph_image/public/12-month-hotel-occupancy-rate-april-2019-2020-2021-2022-2023-2024-bar-graph-06-03-2024-836w-486h.png?itok=Zukf_l1I" class="b-lazy" width="834" height="486" alt="Bar graph: 12-month Hotel Occupancy Rate, April 2019, 2020, 2021, 2022, 2023, and 2024" title="Bar graph: 12-month Hotel Occupancy Rate, April 2019, 2020, 2021, 2022, 2023, and 2024"> Download the full report
Read MoreConsumer Price Index: The Full Picture?
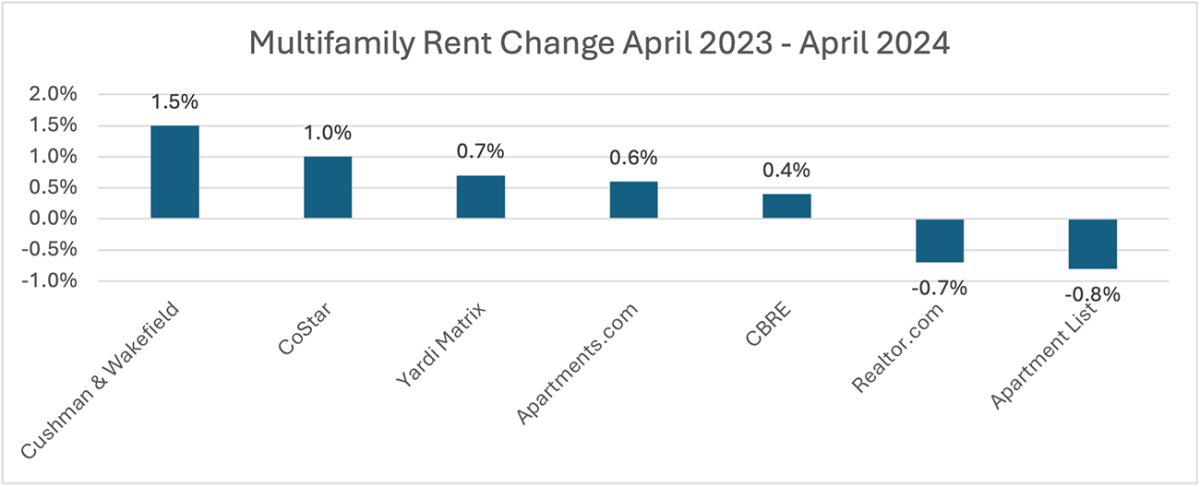
It's been three years since the United States began facing its highest inflation surge since 1981, which peaked at 9.1% in mid-2022. Although progress has been made in reducing the inflation rate through increased interest rates, the latest Consumer Price Index (CPI) report, which tracks the annual price changes of various goods and services, indicates that the inflation rate remains at 3.4%. This is relatively unchanged from the rate a year ago. Since May 2023, the inflation rate has fluctuated between 3.0% and 3.7%. One of the categories measured by the CPI is the change in shelter prices. The CPI for shelter includes owners' equivalent rent (how much a property owner would have to pay in rent to be comparable to their cost of ownership), rent, lodging away from home, and tenants' and household insurance. Since April 2023, shelter costs have increased by 5.4%, right behind the 11.2% rise in transportation services. While the 5.4% increase in shelter costs is concerning and adds to inflation, it may not fully represent the overall situation. As a result, the actual inflation rate could be lower than the reported 3.4%. Many real estate firms publish their own data on rent changes, resulting in a range of figures. For multifamily rents, changes ranged from -0.8% to 2.8% between April 2023 and April 2024. These figures align relatively well with the Federal Reserve's target inflation rate of around 2%. " data-src="https://cdn.nar.realtor/sites/default/files/styles/inline_paragraph_image/public/economists-outlook-multifamily-rent-change-april-2023-to-april-2024-bar-graph-06-03-2024-1300w-528h.png?itok=ZTy3ez5h" class="b-lazy" width="1200" height="487" alt="Bar graph: Multifamily Rent Change, April 2023 to April 2024" title="Bar graph: Multifamily Rent Change, April 2023 to April 2024"> These differences can be attributed to the varying methodologies used by each source. Realtor.com, Apartment List, and Apartments.com track rent changes based on the properties they manage, list, or are otherwise involved with. In contrast, CBRE and Yardi Matrix gather rental data from a variety of markets, while Cushman & Wakefield combine data from the properties they manage with rental data from external sources. These varying figures can also be seen when looking at single-family rent changes during this same period, albeit with less variation. " data-src="https://cdn.nar.realtor/sites/default/files/styles/inline_paragraph_image/public/economists-outlook-single-family-rent-change-april-2023-to-april-2024-bar-graph-06-03-2024-1300w-593h.png?itok=ASNxuXGf" class="b-lazy" width="1200" height="547" alt="Bar graph: Single-family Rent Change, April 2023 to April 2024" title="Bar graph: Single-family Rent Change, April 2023 to April 2024"> Unlike multifamily rents, single-family rents increased for each of the sources. Both multifamily and single-family rents have increased less than the 5.4% reported in the CPI, with multifamily rents averaging a 0.7% increase and single-family rents averaging a 3.2% increase across various sources. While these sources do not represent all firms that publish rental data, it is reasonable to infer that the actual increase in shelter costs may be lower than the reported 5.4%. Therefore, the true inflation rate could be lower than the 3.4% indicated by the CPI.
Read MoreBuilt-for-Rent Housing Starts Continue to Increase
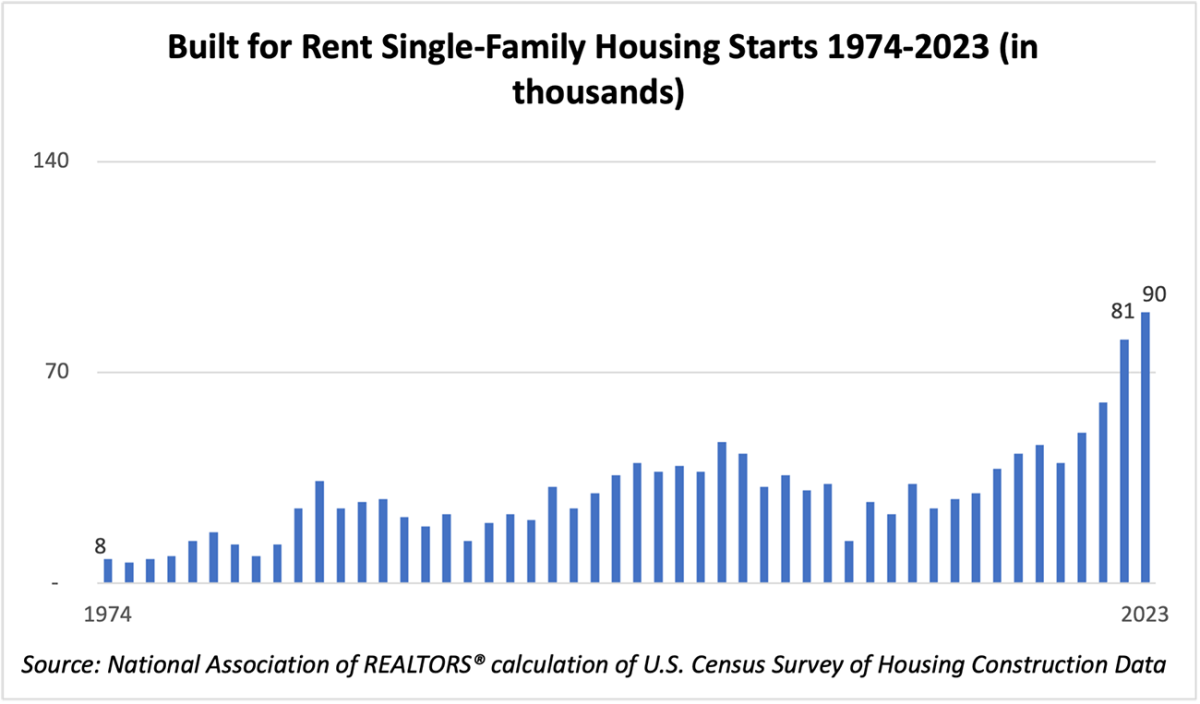
There is no question that the housing market is in a gridlock, with homeowners unable or unwilling to move due to low-interest rate mortgages. The need for new construction is one solution to this problem, which could alleviate the housing inventory crisis. At the same time, there is a shortage of inventory, and home prices have jumped, even in a high-interest rate environment, making the dream of homeownership completely out of reach for many. First-time buyers are now in their mid-to-late 30s when they purchase their first property. To reach homeownership, first-time buyers have higher incomes and are wealthier. So, what happens to those who cannot reach homeownership today? Home builders have seen this data and seen, in turn, an opportunity: built-for-rent. Built-for-rent is the concept of new single-family home construction for the intent of renting. While there has been growth in new home sales and construction activity, multifamily home construction has also grown in recent years. However, an apartment may not have enough square footage for some renters. With this concept, a yard for a pet, space for a home office, and room for a new baby becomes more accessible. Renting a single-family home in a new housing community may also come with amenities not seen in the typical apartment, such as walking paths, pickleball courts, or even shared gardens. Calculating data from the U.S. Census Bureau's Survey of Construction Data shows that the one-year growth in built-for-rent single-family housing starts grew to 90,000 units in 2023 (from 81,000 units in 2022). " data-src="https://cdn.nar.realtor/sites/default/files/styles/inline_paragraph_image/public/economists-outlook-built-for-rent-single-family-housing-starts-1974-to-2023-bar-graph-06-03-2024-1300w-763h.png?itok=WWH9upkZ" class="b-lazy" width="1200" height="704" alt="Bar graph: Built-for-rent Single-family Housing Starts, 1974 to 2023" title="Bar graph: Built-for-rent Single-family Housing Starts, 1974 to 2023"> However, while the number of units rose, the share of all housing starts is significant to watch. The share of built-for-rent single-family homes grew from 5% in 2021 to 10% in 2023, thus doubling in two years. Both the share of homes and the number are the largest numbers collected since 1974 for this segment of the market. " data-src="https://cdn.nar.realtor/sites/default/files/styles/inline_paragraph_image/public/economists-outlook-share-of-built-for-rent-among-all-single-family-housing-starts-1974-to-2023-line-graph-06-03-2024-1300w-763h.png?itok=LRabYSne" class="b-lazy" width="1200" height="704" alt="Line graph: Share of Built-for-rent Among All Single-family Housing Starts, 1974 to 2023" title="Line graph: Share of Built-for-rent Among All Single-family Housing Starts, 1974 to 2023"> All regions saw an annual increase in built-for-rent. When looking at the data by region, there was a notable two-year growth in built-for-rent single-family homes in the Midwest, where it is now 13% of the market, up from 5% in 2021. The Northeast also saw a two-year rise from 3% to 9%. The increase in the South was smaller, at 9%. The West has the smallest share, at 8%. " data-src="https://cdn.nar.realtor/sites/default/files/styles/inline_paragraph_image/public/economists-outlook-regional-share-of-built-for-rent-among-all-single-family-housing-starts-1999-to-2023-line-graph-06-03-2024-1300w-747h.png?itok=_T7QayWO" class="b-lazy" width="1200" height="690" alt="Line graph: Regional Share of Built-for-rent Among All Single-family Housing Starts, 1999 to 2023" title="Line graph: Regional Share of Built-for-rent Among All Single-family Housing Starts, 1999 to 2023"> So, will the market for this type of construction continue to increase? Perhaps if home buying continues to be out of reach for young adults. They will need a bigger space if they have growing families or even just a yard for a dog to play in. Built-for-rent may be their solution—even if temporary—as they save for their down payment for their first home.
Read More
Categories
Recent Posts